Average Rent in Oroville, CA
Apartments & Houses by Size
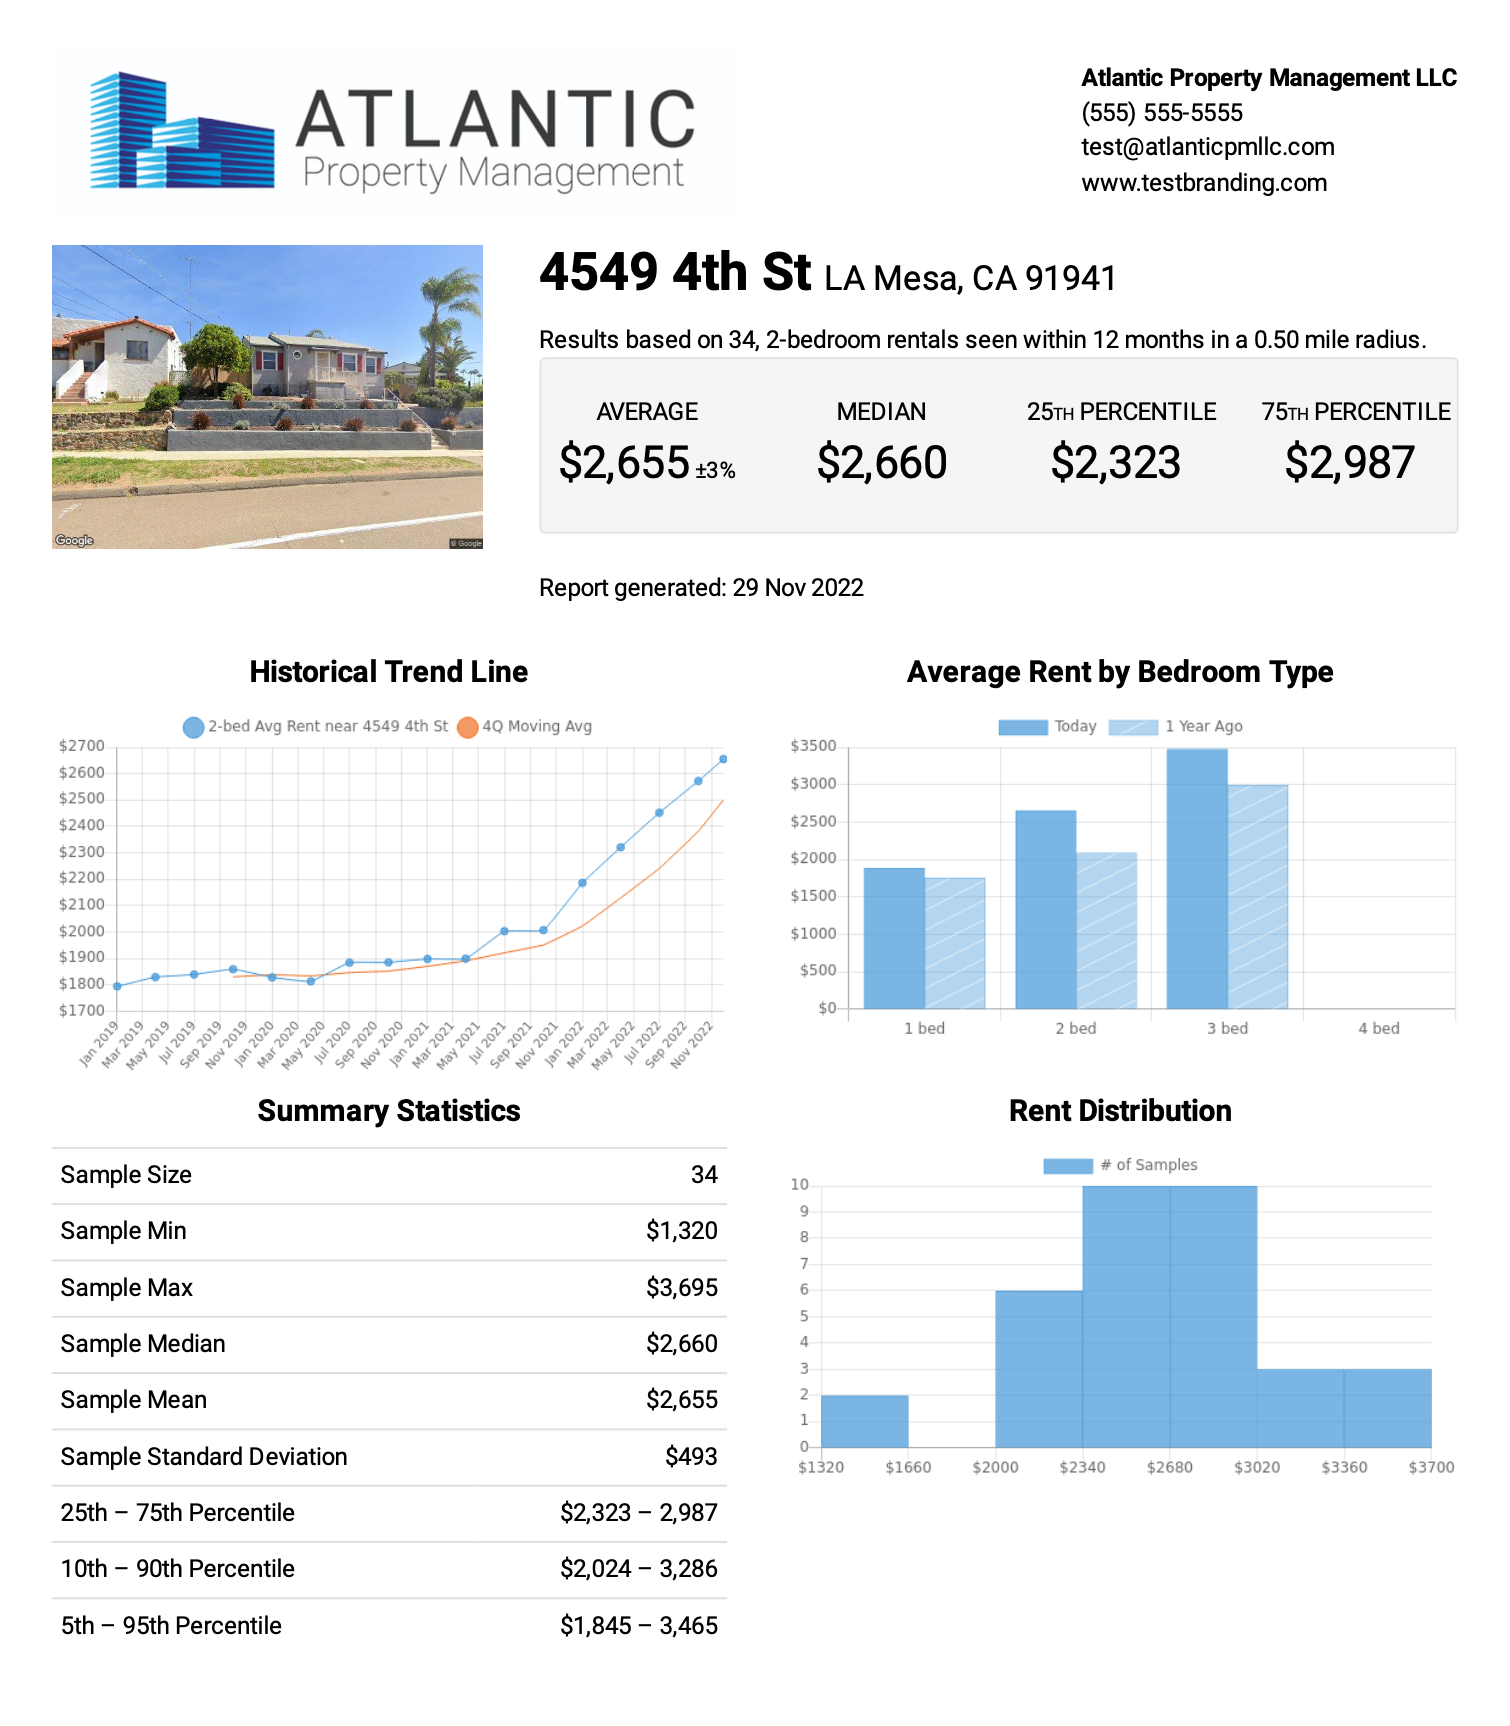
See what properties are renting for on your street
Go beyond area averages and get accurate rent estimates for any address.
Current rent in Oroville (all property types)
- $5,415 1 Bedroom
- $1,274 2 Bedroom
- $1,844 3 Bedroom
- $2,119 4+ Bedroom
Oroville’s rental market offers a diverse mix of apartments and single‑family homes that cater to both young professionals and growing families. Two‑bedroom apartments are particularly popular, with average rents hovering in the $1100s and median figures near $1180, providing an affordable gateway to downtown living. Larger units, such as three‑bedroom apartments and houses, command higher rates, reflecting the city’s blend of modern amenities and classic charm. Single‑family homes dominate the upscale segment, with two‑bedroom houses averaging around $1400 and three‑bedroom homes approaching the $1800 range. For those seeking expansive living space, four‑plus‑bedroom houses reach the $2400s, offering ample room for multigenerational households or home‑based businesses.
Beyond the numbers, Oroville is celebrated for its scenic riverfront, historic downtown district, and proximity to the Sierra Nevada foothills. Residents enjoy easy access to the Feather River, a hub for fishing, kayaking, and waterfront festivals, while nearby Bidwell Park provides extensive trails for hiking and biking. The city’s vibrant community events, local wineries, and boutique shops create a welcoming atmosphere that complements the variety of housing options. Whether you’re looking for a cozy apartment steps from cafes or a spacious house near outdoor recreation, Oroville’s rental landscape delivers flexibility, affordability, and a high quality of life in the heart of California’s Gold Country.
Oroville Rent by Property Type & Bedroom Count
Averages, medians, and ranges across recent rental listings
Overall average rents for this area are always free — see the summary just below.
Current rent in Oroville (all property types)
- $5,415 1 Bedroom
- $1,274 2 Bedroom
- $1,844 3 Bedroom
- $2,119 4+ Bedroom
Note: This analysis includes only bedroom types with sufficient data.
About this data
Rent statistics, listings analysis, and visualizations on this page are produced by Rentometer, Inc.
If you cite, share, or republish data from this report, please credit Rentometer.