
Rentometer Quarterly Rent Report: Nationwide Rent Price Changes in Q2 2024
For the past two years, Rentometer has closely monitored rent prices for three-bedroom (3-BR) single-family rentals (SFRs)—a type of property that appeals to both renters and investors. We have conducted a rent price analysis of 3-BR SFRs in 692 cities across the U.S. to illustrate how rents have changed in Q2 2024 compared to the same period last year. Download the full report and dataset below!
DOWNLOAD REPORT (PDF) DOWNLOAD DATASET (XLSX)
Report Summary
Rentometer has conducted a rent price analysis of 3-BR SFRs in 692 cities across the U.S. to see how rents have changed since this time last year.
Some key highlights from the nationwide analysis are as follows:
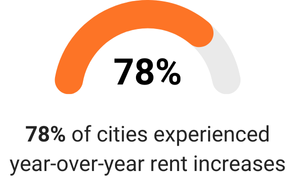
- 78% of cities experienced year-over-year rent increases
- 18% of cities experienced double digit year-over-year rent increases, which is up from 16% last quarter
Report Methodology
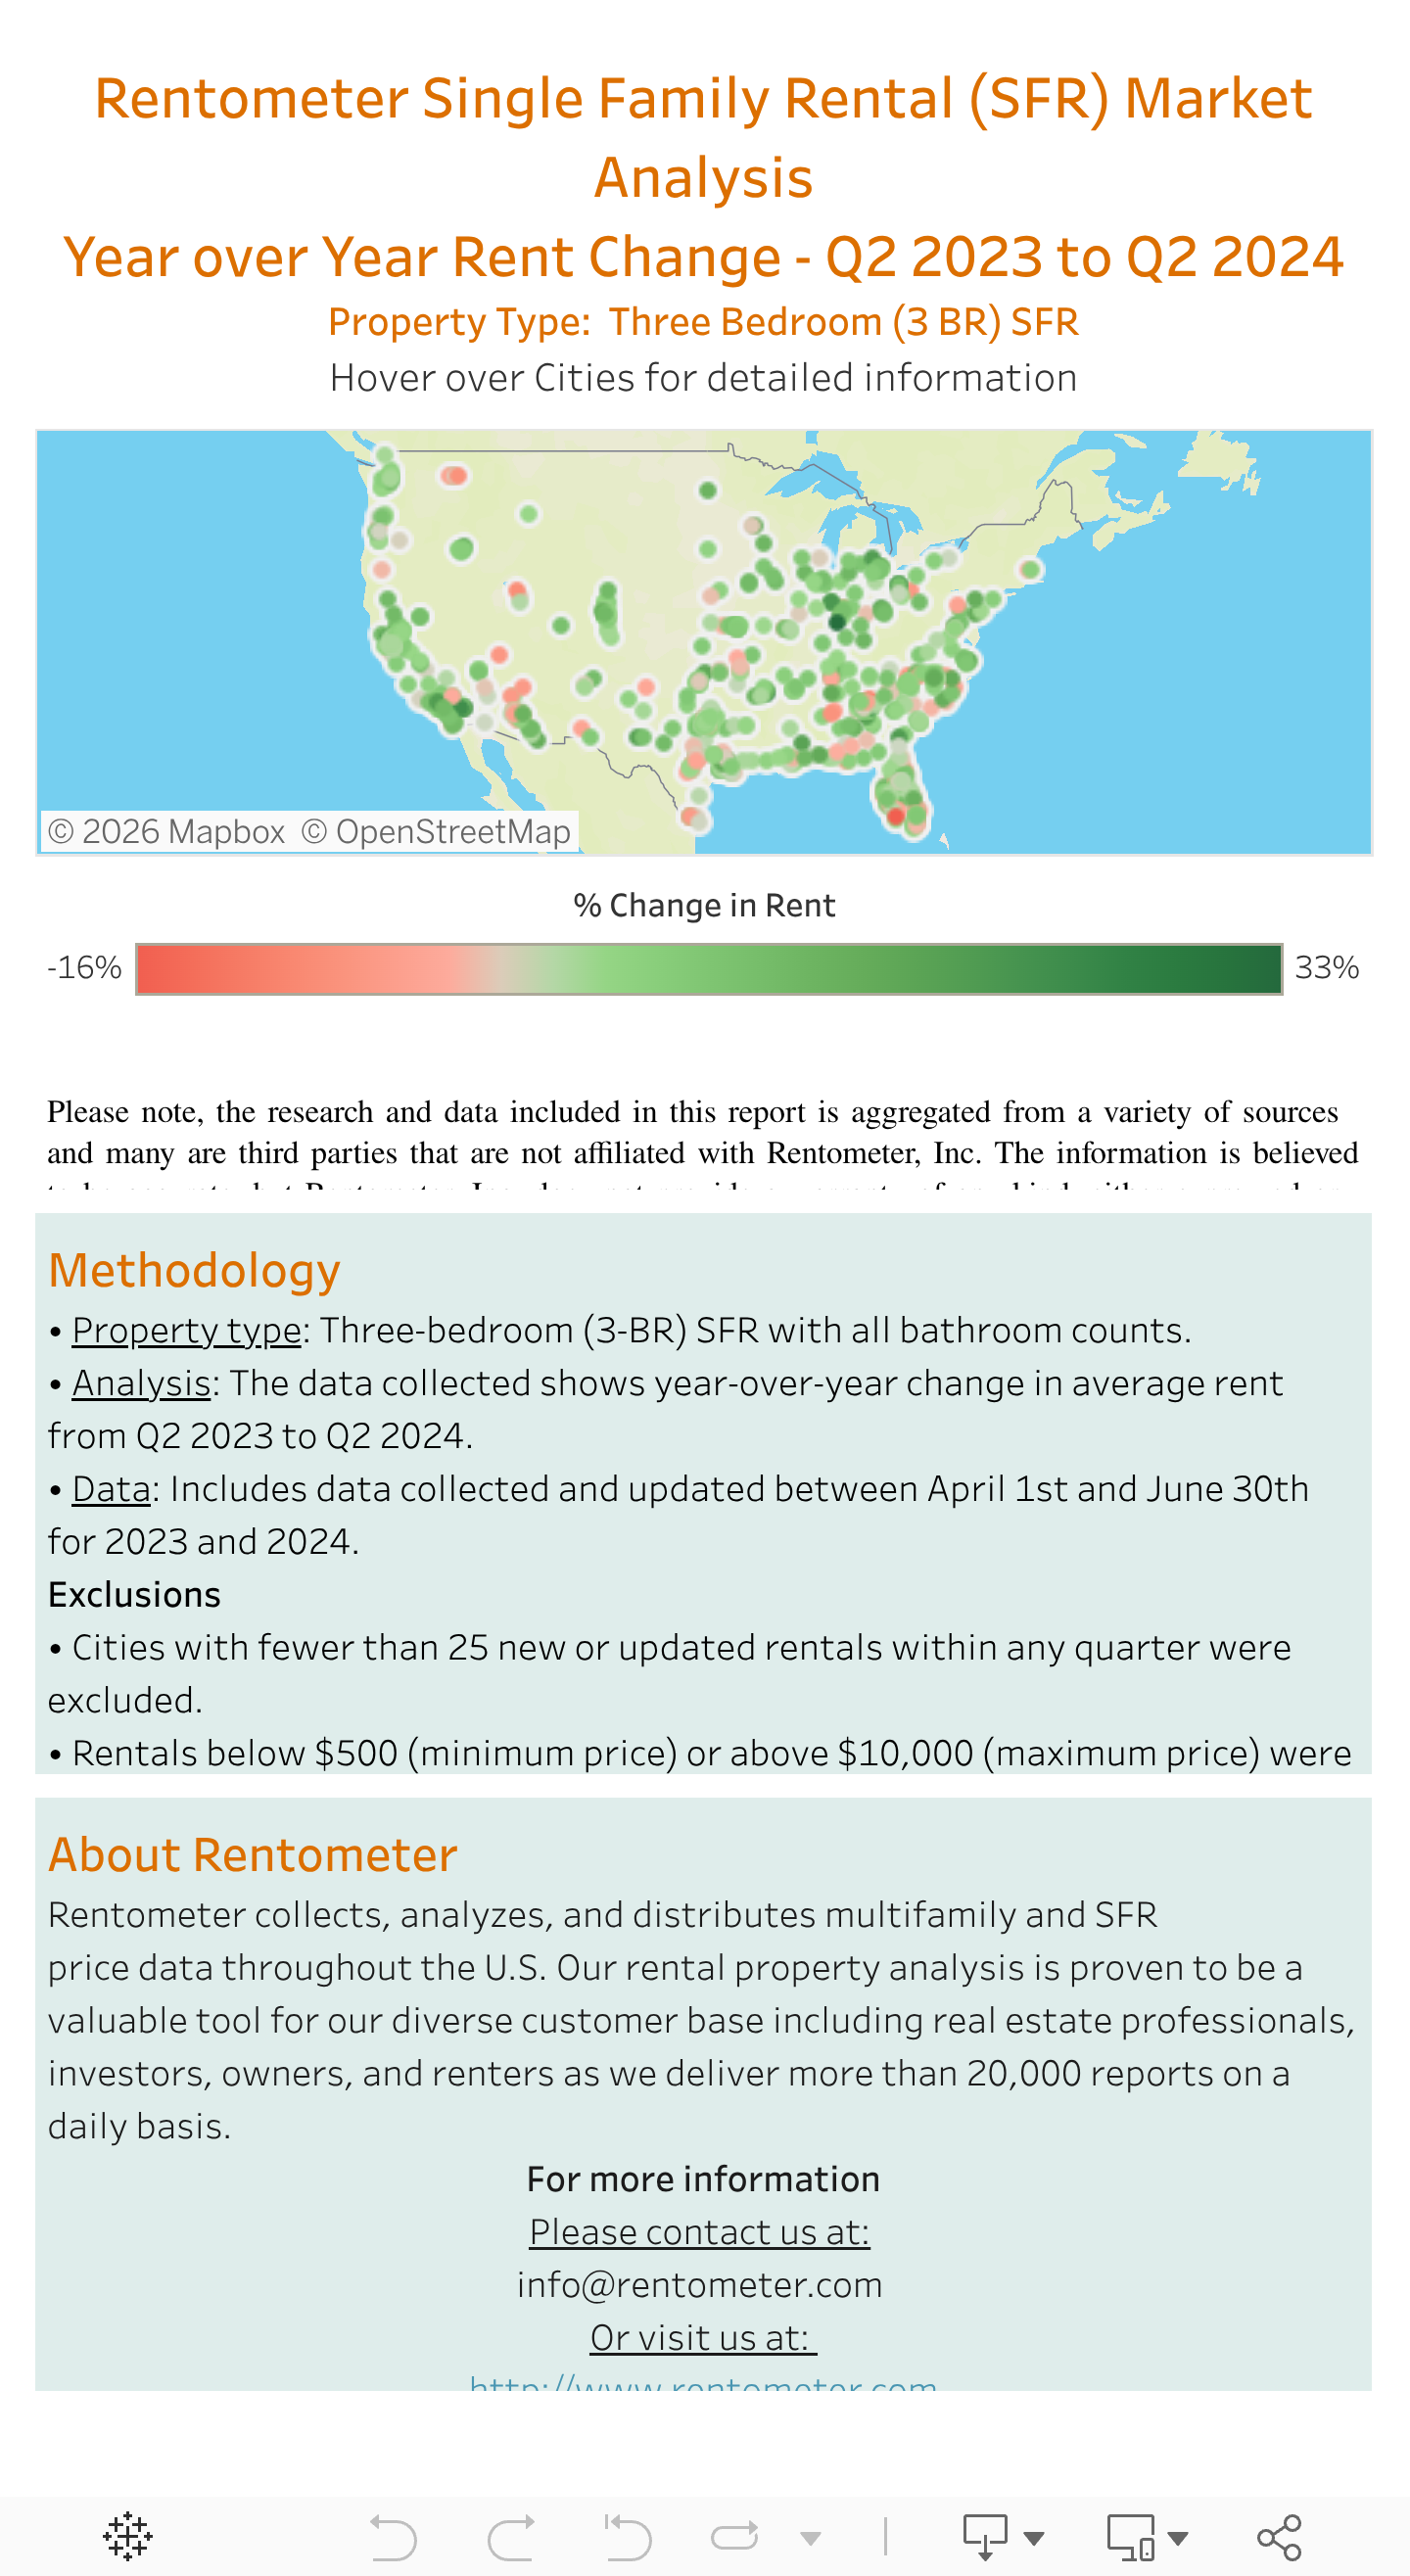
- Geography: SFR markets in 692 U.S. cities across six regions.
- Property type: 3-BR SFRs with all bathroom counts.
- Analysis: Rent data was analyzed year-over-year for Q2 2023 and Q2 2024.
- Data: Includes data collected and updated between April 1st and June 30th for 2023 and 2024.
- Exclusions:
- Cities with fewer than 25 new or updated rentals within any quarter.
- Rentals below $500 (minimum price) or above $10,000 (maximum price).
Rentometer National Rent Map: Q2 2023 - Q2 2024
About Rentometer
Rentometer is the nation's leading source for rent data. We collect, analyze, and distribute multifamily and SFR rent price data throughout the U.S. Our rental data is proven to be valuable for our diverse customer base including real estate investors, property managers, agents, other real estate professionals, and renters as we deliver more than 20,000 reports on a daily basis. For more information, please contact us at info@rentometer.com or visit us at www.rentometer.com.