U.S. Single-Family Rental Market Report: Mid-Year 2026
Rentometer has published its latest Single-Family Rentals Report, covering the first six months of the year and highlighting rent prices and trends across the U.S.
The report focuses on median rents for 3-bedroom single-family homes in 1,099 cities nationwide. Single-family home rentals house 41% of the U.S. renter population, and three-bedroom single-family homes are a preferred option for many families and investors.
Our data set includes over 10 million new rental records annually, based on advertised asking rents, which serve as the foundation for our market reports.
Key Takeaways
- National single-family rents declined 1.6% year over year during the first half of 2026, marking the first sustained national slowdown since the post-pandemic rental boom.
- The usual spring and early summer leasing season failed to lift rents, with the national median asking rent remaining unchanged between the first and second quarters of 2026.
- Growing rental supply continued to pressure pricing, as elevated apartment deliveries, build-to-rent communities, concessions, and “accidental landlords” increased competition across many markets.
- Nearly half (49%) of the 1,099 markets analyzed recorded annual rent declines, with larger cities proving the weakest-performing segment.
- Regional performance diverged sharply. Many Sun Belt markets continued to cool, while technology-driven Bay Area markets such as San Francisco and San Jose recorded some of the strongest rent growth among large U.S. cities.
- The most expensive and affordable rental markets remained concentrated at opposite ends of the country, with California dominating the highest-priced markets and the Midwest and parts of the South remaining the nation’s most affordable.
National Single-Family Rents Decline as Seasonal Momentum Fades
The U.S. single-family rental market continued to cool during the first half of 2026, with the national median rent reaching $2,100, down 1.6% year-over-year. The decline represents a notable reversal from the 1.7% increase recorded during the first half of 2025 and marks the first sustained national slowdown in single-family rents since the post-pandemic boom.
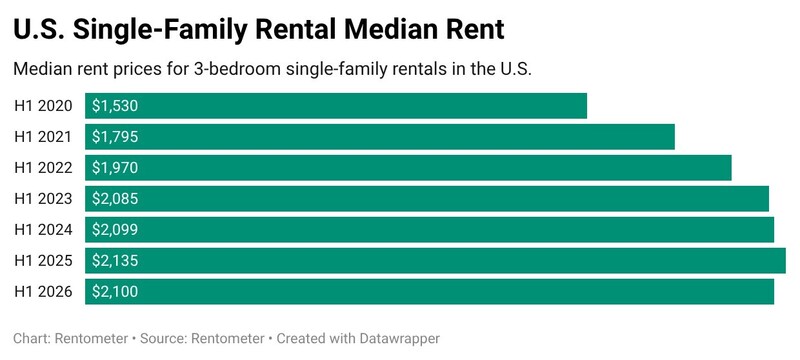 While annual figures suggest only modest movement, they conceal a more significant turning point that occurred over the past year. Rents increased by approximately 1.7% during the first half of 2025 but began declining during the second half of the year, effectively erasing those gains by year-end. That softer pricing environment has carried into 2026.
Another notable feature of the first half of the year was the absence of the typical seasonal lift. The national median rent remained unchanged at $2,100 in both the first and second quarters, even as the market moved through its traditional peak leasing season. Historically, rents tend to increase during the spring and early summer months as demand picks up. The lack of any seasonal increase suggests pricing momentum remained weak even during some of the year’s busiest leasing months.
Regional Performance
Regional performance was mixed, with the Pacific and Southeast posting the largest declines, while the Midwest and Northeast remained stable and the Rocky Mountains region recorded modest growth.
| Region | Median Rent H1 2026 | YoY Change |
|---|---|---|
| Pacific | $3,195 | -3.2% |
| Rocky Mountains | $2,332 | +0.3% |
| Northeast | $2,300 | 0.0% |
| Southeast | $2,000 | -2.9% |
| Southwest | $1,995 | -0.3% |
| Midwest | $1,750 | 0.0% |
The Pacific region posted the largest decline among all major regions, with median rents falling 3.2% year-over-year to $3,195. The correction continues the normalization seen across several high-cost Western markets following the extraordinary rent growth experienced during the pandemic years. Notable exceptions were tech-centric San Francisco and San Jose, both of which recorded solid rent growth, a divergence we
explore in more detail later in the report.
The Southeast also experienced a meaningful decline, with median rents falling 2.9% to $2,000. The region has seen substantial new housing supply over the past two years, including some of the nation’s highest levels of multifamily and build-to-rent (BTR) development. The resulting increase in rental inventory has helped ease the intense competition that previously drove some of the country’s fastest rent increases.
The Rocky Mountains was the only region to record positive annual growth, albeit a modest 0.3%, indicating a market that has largely stabilized after several years of rapid expansion.
Meanwhile, the Midwest and Northeast remained stable, posting no year-over-year change. The lack of movement suggests these regions have largely reached an equilibrium after several years of elevated rent growth.
Rental Supply, Concessions, and Market Competition
The decline in single-family rents has occurred against a backdrop of rising vacancy rates and increasing rental supply across the broader U.S. rental market. According to the U.S. Census Bureau, the overall rental vacancy rate reached 7.3% in the first quarter of 2026, the highest level since the third quarter of 2017. While this measure includes all rental housing types, it reflects a market where renters have significantly more options than they did during the post-pandemic supply crunch.
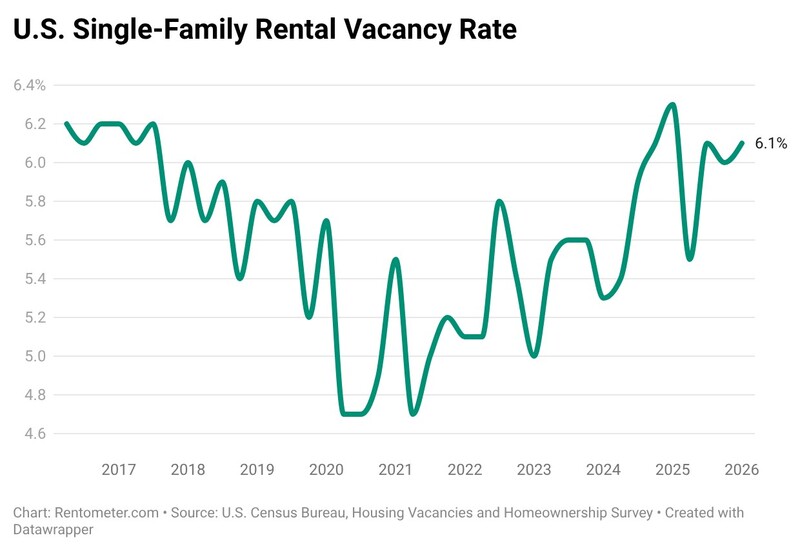
Within the single-family rental sector, vacancy rates remain elevated relative to the exceptionally tight conditions that prevailed during the post-pandemic years. The SFR vacancy rate measured 6.1% in Q1 2026, compared with 6.3% a year earlier. While the slight year-over-year decline suggests little meaningful change in market conditions, vacancy rates remain well above the levels recorded between 2021 and 2023.
Much of the increased competition has been driven by a wave of new multifamily deliveries. To accelerate lease-ups, many apartment operators have turned to concessions, including free rent, discounted move-in costs, and other leasing incentives. According to RealPage, 16.9% of U.S. apartment units were offering concessions in April 2026, up 4.4 percentage points year over year and the highest share since mid-2014. Zillow reported that nearly 40% of rental listings on its platform included concessions, up about 5 percentage points from a year earlier. Meanwhile, Colliers found that concession dollars reached a record $129 per unit in the first quarter of 2026, although only about one-quarter of units offered incentives, suggesting discounts remain concentrated in specific markets and property types.
The competitive landscape extends beyond traditional apartments. Many newly delivered build-to-rent communities, which compete directly with single-family rentals, have also relied on concessions to lease vacant homes.
An additional source of rental supply has emerged from the for-sale housing market. As home sales have slowed and some sellers have been unwilling to accept lower offers, a growing number have chosen to rent out their properties instead. Zillow found that 2.3% of homes listed for rent on its platform had previously been listed for sale, the second-highest share on record and the highest since late 2022. These “accidental landlords” have added to the supply of available single-family rentals, particularly in softer housing markets, providing renters with more options and contributing to the subdued rent growth observed in many regions.
As renters compare a wider range of options, these incentives have likely limited landlords’ ability to raise asking rents, helping explain the weak pricing environment observed during the first half of 2026.
There are, however, early signs that supply pressures in the single-family rental market may be beginning to ease. Recent earnings updates from several of the largest publicly traded SFR landlords suggest that SFR inventory remained elevated in their markets early in the year, although the pace of listings growth began to slow during the latter months of the first half of 2026. These observations are limited to the markets in which these operators have a significant presence and should not necessarily be interpreted as a nationwide trend.
A recent John Burns Research & Consulting report, which tracks leasing activity across more than 250,000 professionally managed rental homes across more than 50 U.S. markets, reached a similar conclusion, noting that the pace of SFR listings growth was slowing. While John Burns attributed part of this trend to early signs of improvement in the resale market, recent national housing data suggest the broader for-sale market remains constrained by high mortgage rates and affordability challenges.
While these developments suggest that supply pressures in the SFR market may be starting to ease, Rentometer’s pricing data has yet to show a meaningful national impact. Ongoing competition from apartments offering concessions and newly delivered build-to-rent communities may continue to be offsetting any benefit from slower SFR listings growth. The national median asking rent remained unchanged between the first and second quarters of 2026, indicating that any improvement in market balance has not yet translated into stronger pricing power for landlords.
Regional Differences Persist
While the national median asking rent declined compared with the first half of 2025, rent trends varied considerably across local markets. Of the 1,099 markets included in this report, 49% recorded year-over-year rent declines, while 37% posted rent increases of at least 1%. The remaining markets were broadly flat, with annual rent changes between 0% and +1%.
Larger cities proved to be the weakest-performing segment. Among cities with populations of 250,000 or more, 67% experienced declining rents. By comparison, rent declines were recorded in 58% of mid-sized cities (100,000–250,000 residents) and 61% of small cities and towns (100,000 residents or fewer).
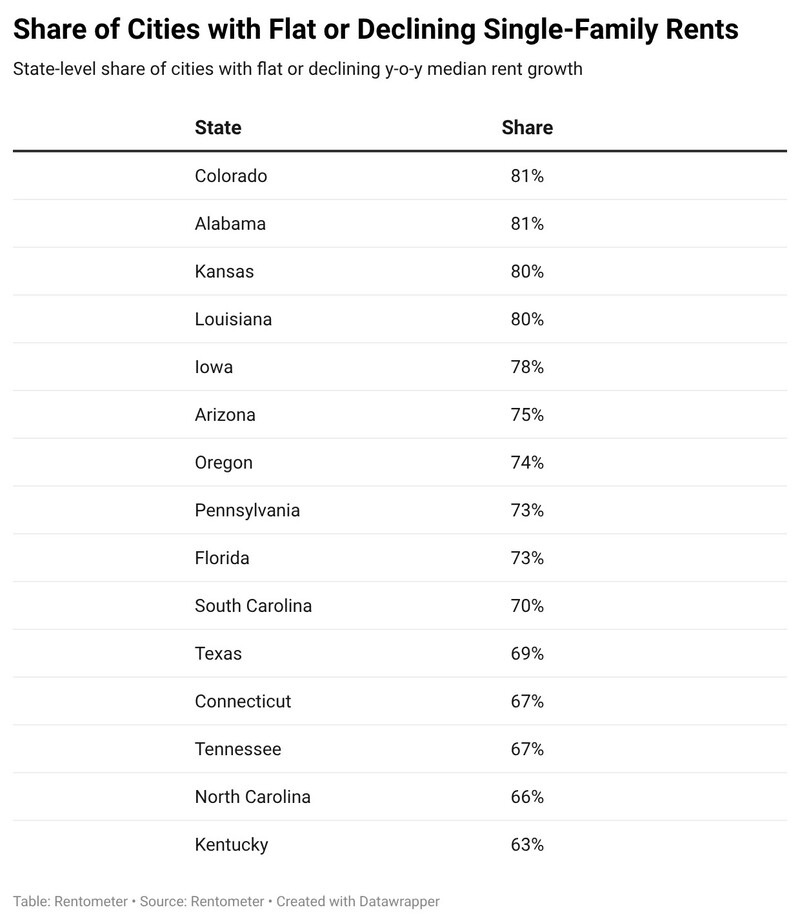
At the state level, rent softness was particularly widespread in Colorado, Alabama, Kansas, and Louisiana, where 80% or more of the markets tracked recorded either flat or declining rents. By contrast, several states proved considerably more resilient. Only 27% of tracked markets in Mississippi experienced flat or declining rents, followed by Virginia (30%), Ohio (39%), New Jersey (40%), and Oklahoma (41%), indicating that the majority of local markets in these states continued to post positive year-over-year rent growth.
Diverging Fortunes: Sun Belt Weakness vs. Bay Area Resurgence
While many of the pandemic’s fastest-growing Sun Belt markets continued to experience rent declines during the first half of 2026, several technology-driven markets in Northern California bucked the national trend. The contrast highlights how increasingly localized rental market conditions have become.
Among the largest U.S. cities, Miami (-2.8%), Tampa (-3.2%), Phoenix (-2.2%), Nashville (-2.0%), and Dallas (-2.2%) all recorded year-over-year declines in median single-family rents. Other Sun Belt markets, including Las Vegas (-2.0%), Austin (-0.9%), Atlanta (-0.2%), and Corpus Christi (-2.6%), also experienced weaker pricing. Many of these markets were among the nation’s strongest performers during the pandemic, but several years of elevated apartment and build-to-rent construction and widespread leasing concessions have created a more competitive environment for landlords.
While several high-growth Sun Belt markets continued to cool, the Bay Area emerged as one of the strongest-performing regions during the first half of 2026. San Francisco (+5.7%) and San Jose (+5.9%) recorded some of the largest year-over-year increases in single-family rents among U.S. cities with populations exceeding 250,000. According to Rentometer data, single-family rents in San Francisco remained largely flat
throughout 2023 and 2024 before rebounding in 2025, with that momentum continuing
into the first half of 2026. San Jose, meanwhile, posted steady rent growth throughout
2023 and 2024 before accelerating further this year.
The recovery extends across much of Silicon Valley and the San Francisco Peninsula. Sunnyvale (+11.1%), Berkeley (+10.0%), Mountain View (+5.6%), San Mateo (+5.5%), Pleasanton (+5.0%), and Fremont (+2.6%) all recorded solid rent growth, reflecting continued strength in many technology-oriented and high-income markets. The rebound has been supported by renewed hiring across the technology sector, particularly in AI-related fields, alongside persistently constrained housing supply. Apartment rents have also bucked the broader national trend in San Francisco, rising amid limited new supply and strengthening demand.
The recovery, however, has not been uniform across the Bay Area. Oakland (-4.4%) continued to experience declining rents, extending its recent downward trend, while nearby San Leandro (-4.4%), Vallejo (-3.4%), Richmond (-0.1%), and Hayward (0.0%) also lagged behind the Peninsula’s stronger performance. The divergence suggests that the resurgence centered on San Francisco and Silicon Valley has yet to meaningfully spill over into much of the East Bay, highlighting how increasingly localized rental market dynamics have become.
The Most and Least Expensive Single-Family Rental Markets
Single-family rental affordability continues to vary dramatically across the United States. At the state level, Hawaii and the District of Columbia shared the highest median asking rent during the first half of 2026 at $3,800, followed by Massachusetts ($3,600), California ($3,450), Rhode Island ($3,300), and New Hampshire ($3,200).
At the other end of the spectrum, West Virginia remained the most affordable state with a median asking rent of $1,400, followed by Alabama and Oklahoma (both $1,550), Arkansas, Kansas, and Ohio (all $1,600).
Among large U.S. cities with populations exceeding 250,000, San Francisco remained the nation’s most expensive single-family rental market, with a median asking rent of $5,280. It was followed by Irvine ($4,800), Los Angeles ($4,495), San Jose ($4,395), Santa Ana ($4,300), and San Diego ($4,295), underscoring California’s continued dominance among the country’s highest-priced urban rental markets. Boston ($4,000) and Washington, D.C. ($3,800) were the only non-California markets to rank among the ten most expensive large cities.
By contrast, the most affordable large cities were concentrated in the Midwest and parts of the South. Toledo, Ohio recorded the lowest median asking rent at $1,248, followed by Detroit, Michigan ($1,300), Fort Wayne, Indiana ($1,345), Memphis, Tennessee and Wichita, Kansas (both $1,395), and Cleveland, Ohio ($1,445). Even the most expensive homes in these markets rented for less than one-quarter of the typical asking rent in San Francisco.
Removing the population threshold reveals an even wider pricing gap. West Hollywood, California, topped all markets in the Rentometer database with a median asking rent of $8,200, ahead of Laguna Beach ($7,995), Beverly Hills ($7,500), Newport Beach ($6,900), and several other affluent California coastal communities. Florida also featured prominently, with Coral Gables ($6,375) and Miami Beach ($6,350) ranking among the nation’s most expensive rental markets.
The most affordable markets were primarily smaller cities across the Midwest and South. Johnstown, Pennsylvania, recorded the lowest median asking rent nationwide at just $951, followed by Waterloo, Iowa ($1,035), Flint, Michigan ($1,050), Albany, Georgia ($1,058), and Anderson, Indiana and Decatur, Illinois (both $1,100). At less than $1,000 per month, the typical asking rent in Johnstown was nearly 89% lower than in West Hollywood, illustrating the extraordinary geographic variation in U.S. single-family rental costs.
Explore the Full Nationwide Dataset
Dive into the full rent dataset powering this report. Use the interactive table below to sort, search, and explore key rent data for almost 1,100 U.S. cities—all in one place.
Methodology
The methodology that Rentometer used to complete our nationwide rent price analysis is as follows:
- Geography: Rental markets in 1,099 U.S. cities across six regions.
- Property type: 3-bedroom single-family rentals (SFRs), regardless of bathroom count.
- Data source: Analysis is based on advertised rent prices collected and updated between January 1st and June 30th for both 2026 and 2025.
- Metric: Rentometer reports median rents rather than average rents to better reflect typical market conditions and reduce the impact of extreme outliers.
- Analysis: Year-over-year comparison of rent data for the first half of 2026 (Q1–Q2) versus the first half of 2025 (Q1–Q2).
- Exclusions:
- Cities with fewer than 25 new or updated rental listings in any quarter were excluded.
- Rentals with advertised monthly prices below $500 or above $10,000 were excluded.
Know What Any U.S. Property Could Rent For
National trends show you the big picture. Rentometer gives you a localized rent estimate based on comparable rental properties nearby, so you can understand the market and price with confidence.
Get Rent Comps