Single-Family Rental Hotspots Ranked by Real-Time Gross Yield
December 2, 2025
Executive Summary
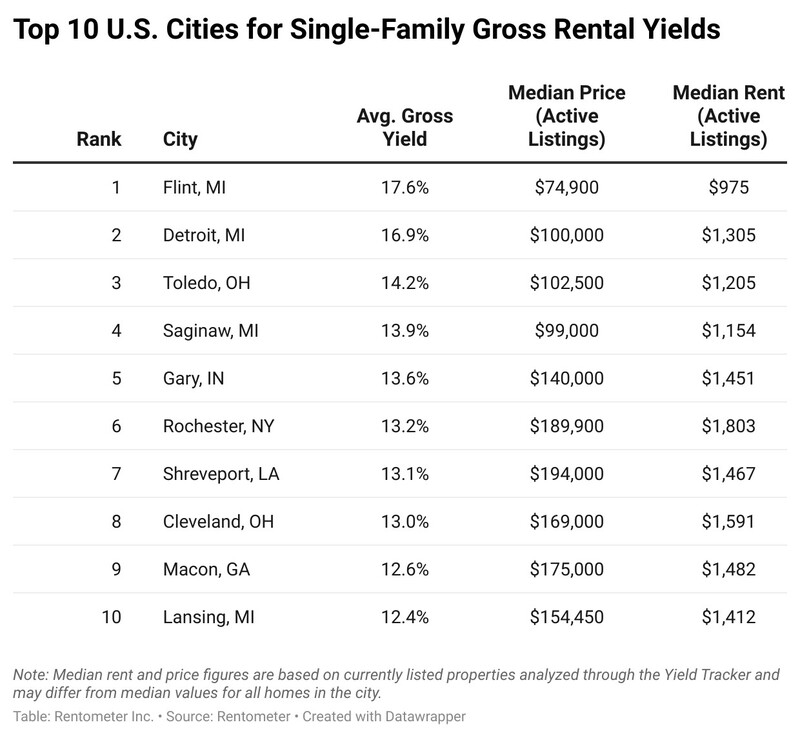
- High-yield markets are concentrated in smaller, affordable metros. Rentometer’s Yield Tracker identifies over 40 cities delivering gross rental yields above 10%—dominated by Great Lakes, Midwest, and Southern markets such as Flint, Detroit, Toledo, Saginaw, Gary, and Rochester.
- Real-time listing data reveals a different yield landscape than citywide averages. In many metros, active listings are significantly more expensive than overall home values, meaning real investor yields can differ sharply from theoretical city averages.
- Lower-yield markets cluster in high-growth, high-cost metros. West Coast, Mountain West, and Sun Belt cities—including Phoenix, Boise, Portland, Salt Lake City, and many California metros—show gross yields in the 5–6% range due to elevated prices and moderated rent growth.
- Gross-yield hotspots do not align with the metros where investors are buying the most. Cotality’s leading investor-purchase markets (Dallas, Houston, Atlanta, Phoenix, Los Angeles, Tampa) show much lower yields, while many of Rentometer’s top-yielding cities see comparatively limited investor activity.
- Key exception: A few major metros—Chicago, St. Louis, and Detroit—stand out for combining strong yields with high investor purchase volume, signaling a rare alignment of price, demand, and opportunity.
In spring 2025, we reported on the hottest markets for single-family rentals based on gross yield — calculated using Zillow’s average home values and Rentometer’s average rents for each city. That report provided investors with valuable insight into where rent-to-price ratios were strongest across the U.S.
Today, we’re taking that analysis a step further.
Introducing the Rentometer Yield Tracker
With the launch of Rentometer’s new Yield Tracker, investors can now explore curated lists of single-family homes for sale, complete with Rentometer rent estimates and automatically calculated gross rental yields. This allows users to quickly identify the most promising investment opportunities that meet their criteria — without manual calculations or guesswork.
Unlike our previous reports, which used citywide averages, this updated analysis computes the average gross yield based on all current homes for sale in each city, reflecting actual active listings rather than general market averages.
Why does that matter? Because in many markets, the homes currently for sale don’t align with citywide averages. In some cities, the active listings are considerably more expensive than the overall median home value — which means real-world yields can be lower than what broader or historical data might suggest.
Take Baltimore, MD, for example: while the city’s average home value is around $185,000, the median listing price is closer to $230,000 — a difference of nearly 25%. New Orleans is another great example — while the typical home value is around $238,000, the median listing price is closer to $338,000, nearly $100,000 higher. This gap highlights a broader trend across many markets, where affordable starter homes are increasingly hard to find, and available inventory is skewed toward higher-priced properties.
For investors, this distinction is crucial. The median listing price reflects what’s actually available to purchase today — not a theoretical market average — and therefore provides a much clearer picture of attainable returns and true investment potential.
This new methodology gives a more accurate and realistic snapshot of gross rental performance for today’s buyers.
Where High-Yield Markets Are Concentrated
When we look at the cities with gross rental yields of 10% or higher, a clear geographic pattern emerges. The majority of these high-return markets are clustered around the Great Lakes region — including cities in Michigan, Ohio, Indiana, and upstate New York — where home prices remain relatively affordable compared to national averages, but rent levels have held steady.
Cities such as Flint, Detroit, Toledo, Saginaw, Cleveland, Gary, and Rochester continue to dominate the list. These are long-established industrial hubs that have experienced years of population and economic fluctuation, but they now offer some of the most attractive prices for single-family rentals in the country. For investors focused on cash flow over appreciation, this region remains a standout.
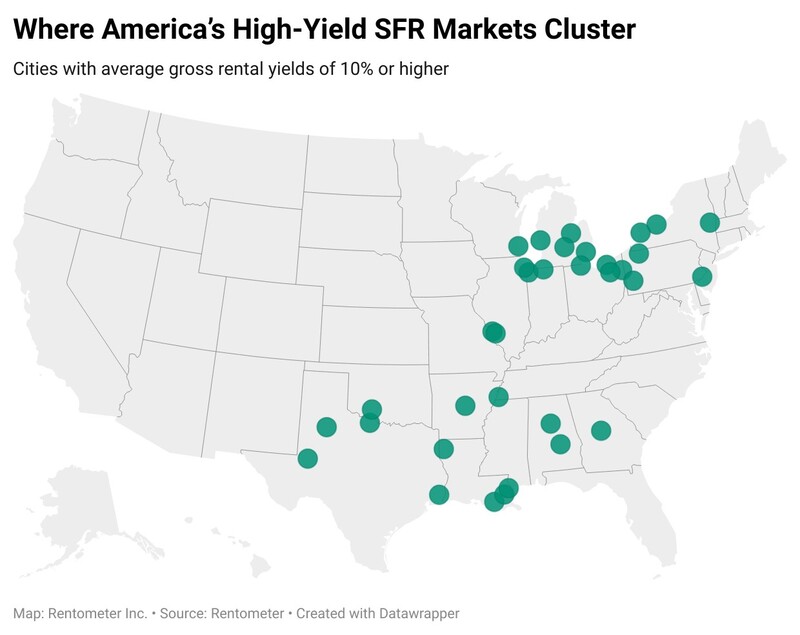
Beyond the Great Lakes, there are smaller clusters of high-yield markets in northwest and southeast Texas — including Beaumont, Odessa, and Wichita Falls — where housing costs are still relatively low and rental demand is supported by strong employment in energy, manufacturing, and logistics.
A secondary concentration appears in parts of the Lower Mississippi Valley and Gulf Coast, with markets like Shreveport, Birmingham, Montgomery, New Orleans, and Houma also delivering double-digit yields. These areas tend to have moderate home prices, consistent rental demand, and less investor saturation than coastal metros.
Investors focusing on the Gulf Coast should view thorough flood zone and insurance cost due diligence as a key step, ensuring net returns align with their strategy.
Where SFR Yields Are the Lowest
At the opposite end of the spectrum, cities with average gross yields of 6% or lower are heavily concentrated in regions with historically stronger appreciation markets, high home prices, and tight inventory. These are the metros where rental income hasn’t kept pace with rising property values, making them less favorable for investors focused on immediate cash flow.
A clear pattern emerges across the West Coast, Mountain West, and Sun Belt — particularly in states like Arizona, Oregon, Washington, Colorado, Utah, Idaho, and California. Cities such as Chandler, Gilbert, Beaverton, Bend, Boise, and Salt Lake City reflect markets where housing demand and prices have surged, but rent growth has leveled off. Gilbert was one of the few cities where single-family rent prices fell in the first half of 2025, while Chandler’s rents declined by 2.1% in 2024.
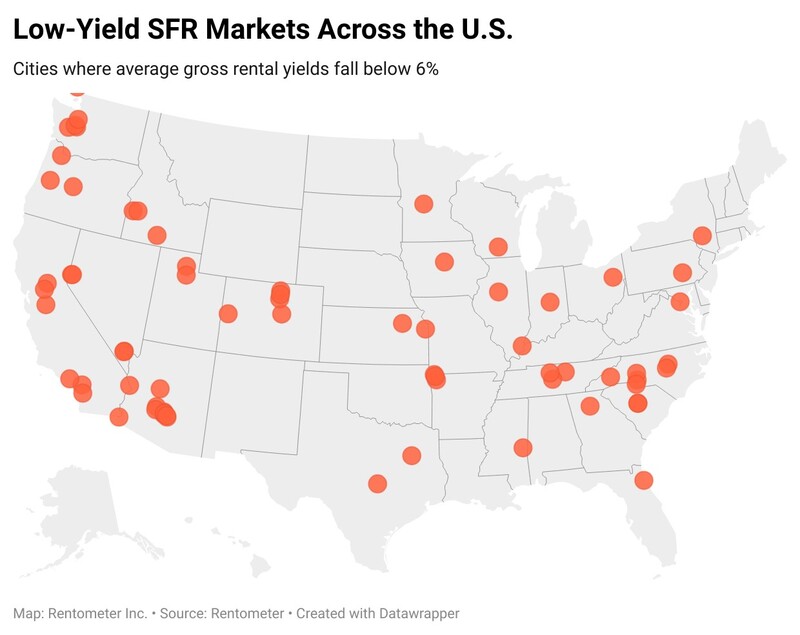
In the Pacific Northwest, a cluster of low-yield cities — Portland, Salem, Eugene, Vancouver, Olympia, and Tacoma — highlights the impact of elevated home values combined with regulatory constraints and slower rent increases. Investors in these markets often prioritize long-term appreciation and stability over short-term income.
The Mountain and Southwest regions tell a similar story. Cities like Phoenix’s suburban corridor (Chandler, Gilbert, Surprise, Peoria) and fast-growing Utah metros (St. George, Washington, and Salt Lake City) offer strong population growth and steady housing demand, but entry prices have climbed beyond what typical rents can support from a yield perspective.
Low-yield conditions are also visible in parts of the Carolinas and Tennessee, including Charlotte, Raleigh, Murfreesboro, and Mount Juliet, where strong job markets and in-migration have driven up home prices faster than rents.
Finally, several California metros — Los Angeles, Roseville, Riverside, Modesto, and Elk Grove — rank among the nation’s lowest-yielding markets, reflecting high barriers to entry and some of the most expensive real estate in the country.
Gross Yield Markets Diverge from Preferred Investor Markets (With Some Exceptions)
A comparison of Rentometer’s top-yielding markets with Cotality’s ranking of metros attracting the most investor purchases in 2025 (January through September) reveals a striking pattern: the markets delivering the strongest gross rental yields are often not the markets seeing the most investor activity.
High-Yield Markets Are Concentrated in Smaller, Under-the-Radar Cities
Rentometer’s highest-yield markets—led by Flint, Detroit, Toledo, Saginaw, Gary, and Rochester—are overwhelmingly located in the Great Lakes region and smaller Midwestern or Southern metros. These cities deliver gross yields of 11–17%, driven by low home prices and steady rental demand.
Yet nearly all of these high-yield markets are absent from Cotality’s list of top investor-purchase metros. Only Chicago, St. Louis, and Detroit appear among the top 20 markets by purchase volume.
Investors Are Concentrated in High-Growth, Higher-Priced Metros
By contrast, Cotality’s top markets for investor purchase volume—Dallas, Houston, Atlanta, Phoenix, Los Angeles, Tampa, and San Antonio—closely follow population and job growth patterns. However, many of these metros offer significantly lower gross yields, often in the 5–8% range.
This creates a notable disconnect: Investors are most active in metros with strong fundamentals and appreciation potential—not in the metros with the strongest rental yields. Several high-activity investor metros (such as Los Angeles, Phoenix, Seattle, Denver, Charlotte, Portland, and Riverside) appear near the bottom of Rentometer’s yield rankings, with gross yields between 5–6%.
Investor Share Leaders Skew Toward Mid-Sized Cities, Not High-Yielding Ones
Cotality’s separate ranking of metros by the share of investor purchases (rather than total volume) adds another layer of insight. Cities like McAllen, El Paso, and Wichita rise to the top, driven mostly by medium-sized investors rather than mega-investors.
But even in these markets, the overlap with high-yield cities is limited. Most top-yield metros—such as Flint, Saginaw, Youngstown, Gary, and Albany (GA)—do not appear among cities with elevated investor share, suggesting many of the strongest yield opportunities remain largely overlooked by larger investor groups.
Key Exceptions: Where High Yields and High Investor Activity Align
A few markets stand out as exceptions where strong yields and meaningful investor activity intersect:
- Chicago, IL – 11.7% yield and #6 in investor purchase volume
- St. Louis, MO – 11.5% yield and #14 in investor purchase volume
- Detroit, MI – 16.9% yield and #18 in investor purchase volume
These metros show that when pricing, available inventory, and rental demand align, investors do gravitate toward higher-yield areas.
For a deeper look, investors can explore the full list of over 400 cities below, complete with median rents, listing prices, and gross yields derived from Rentometer’s Yield Tracker—a real-time view of where the numbers truly add up.
Why SFR Demand Remains Strong and Who Really Powers the Market
Single-family homes have long been a sizable—though often underappreciated—segment of the rental housing market. In 2001, nearly 30% of all renters lived in single-family homes. Today, almost twenty-five years later, that share has inched up only slightly to 33%. And contrary to the narrative of a sustained SFR “surge,” the share of single-family homes being rented has actually declined—from roughly one in five in 2014 to about one in six by the end of 2024, according to NAR. Even the recent rise in investor purchase share is unlikely to meaningfully change the long-standing percentage of renters who live in single-family homes.
While institutional investors became more visible after the Great Recession—and often dominate media coverage as major competitors to homebuyers—their actual footprint in the SFR market has remained limited. Their expansion never grew beyond a small fraction of the sector, and that growth has largely stalled. Institutional owners still account for only about 2% of all SFR investors, a share that has remained relatively unchanged for years.
Over the past decade, the U.S. has added approximately 10.7 million single-family homes, and the overwhelming majority were purchased by owner-occupants—not converted to rentals. This underscores an important point often missing from public debate: although the total housing stock has increased substantially, relatively few of those new homes have entered the rental market.
This context matters, because it clarifies who truly drives the SFR sector. The market is overwhelmingly powered by local investors. Mom-and-pop owners represent over 87% of all single-family rental investors, while institutional players account for only about 2% and remain concentrated in just a handful of major metros. Rentometer’s mission is to support these small and mid-sized investors—along with renters—by providing transparent, hyperlocal, and easily actionable rental data.
A recent report from the St. Louis Fed highlights the essential role that SFRs play in today’s housing ecosystem:
- Family-Friendly Housing: SFRs provide an important option for households who prefer a home environment—whether for raising children, for short-term flexibility, or because suitable multifamily rentals are not available nearby.
- Community Access: SFRs offer families a pathway into neighborhoods they might not otherwise access, especially in areas dominated by owner-occupied homes that require higher credit scores or incomes to purchase.
Taken together, these factors help explain why demand for SFR housing remains strong and remarkably stable. Elevated mortgage rates and high home prices continue to keep many would-be buyers on the sidelines, but single-family rentals have consistently housed roughly one-third of all renters for more than two decades. Even as mortgage rates eventually ease or affordability improves, the underlying demand for SFRs is not expected to fade. Instead, SFRs will continue to support mobility, family stability, and real housing choice for millions—while providing investors with a resilient, diversified, and enduring tenant base across communities nationwide.
Methodology
This analysis was conducted by Rentometer.com in November 2025 and is based on 255,198 active for-sale listings across 476 U.S. markets, paired with Rentometer’s corresponding rent estimates. Rental data comes from Rentometer’s national database of rent comparables and reflects advertised rent prices. Rentals priced below $500 or above $10,000 were excluded
Active single-family home listings were sourced from an external listing aggregator and surfaced through Rentometer's Yield tracker, which pairs real-time for-sale listings with Rentometer’s rent estimates.
Gross rental yield was calculated by dividing estimated annual rental income (based on median monthly rent) by the average active listing price in each market.
Disclaimer
This report is for informational purposes only and should not be considered financial or investment advice. Gross rental yield calculations are based on in-house and publicly available data and estimates and may not reflect actual market performance or individual property outcomes. Always consult with a licensed real estate or financial professional before making investment decisions.
About Rentometer
Rentometer is a Boston-based company that has been providing investors and real estate professionals with rent estimates and comps for over 15 years. Our company collects and analyzes over 10 million new rental records each year, which form the basis of our market reports.
For over the past two years, Rentometer has closely tracked and reported on three-bedroom single-family home rentals. Single-family home rentals house 41% of the U.S. renter population, and three-bedroom single-family homes are a preferred option for many families and investors.
Rentometer was founded by two seasoned real estate entrepreneurs:
Mike Lapsley is a proptech veteran with over 25 years of experience in the rental housing industry. Prior to Rentometer, he was the CEO of RentGrow, a leader in automated resident screening systems, which was successfully acquired by Yardi Systems. Mike holds a BS in Business Management and Accounting from the University of Lowell.
Torrence C. Harder has over forty years of experience investing in entrepreneurial companies. He founded Harder Management Company, Inc., which has founded and ventured sixteen companies. Torrey holds a BA with Honors from Cornell University and an MBA with Honors from the Wharton School of the University of Pennsylvania.
Explore Rents in Your Local Market with Rentometer
Rentometer provides hyperlocal, accurate rental data that helps you move forward with confidence. Make data-driven real estate decisions today!
Get Started