Rentometer Quarterly Rent Report: Nationwide Rent Price Changes in Q4 2023
Rental Market Reports | Quarterly Rent Reports | Single-Family Home Reports | Apartment Reports | Get Started with Rentometer Pro
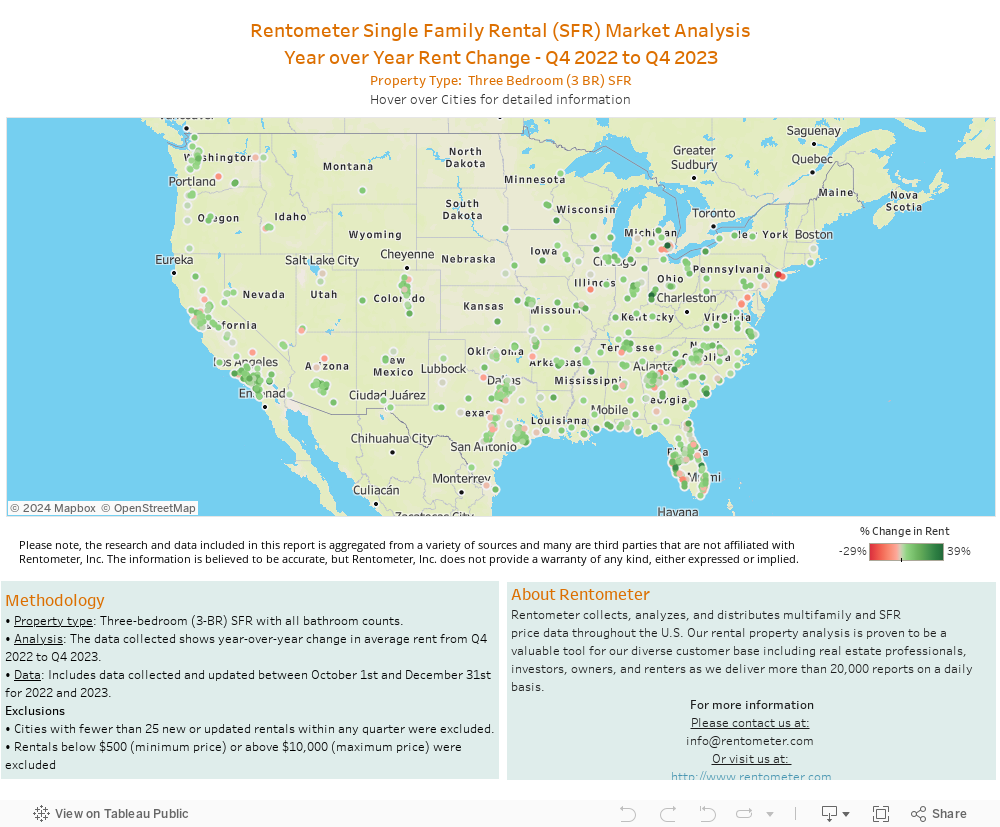
Over the past year, Rentometer has closely monitored rent prices for three-bedroom (3-BR) single-family rentals (SFRs). Single-family homes are an attractive option for renters looking for more space. There are various factors influencing home prices, including high demand, low supply of inventory, and interest rates continuing to increase. You may be wondering how these factors have affected rent prices. Let's take a closer look.
Table of Contents:
2. Methodology
3. Nationwide Rent Price Analysis
4. Midwest Rent Price Analysis
5. Northeast Rent Price Analysis
6. Pacific Rent Price Analysis
7. Rocky Mountains Rent Price Analysis
8. Southeast Rent Price Analysis
9. Southwest Rent Price Analysis
10. Conclusion
Rentometer has compiled a rent price analysis of 3-BR SFRs in 646 cities across the U.S. to see how rents have changed since this time last year.
Some key highlights from the nationwide analysis are as follows:
- 82% of cities experienced year-over-year rent increases
- 24% of cities experienced double digit year-over-year rent increases, which is up from 19% last quarter
The remainder of this report contains our nationwide analysis of Q4 2023 average rent prices and how they have changed over the past year.
2: Methodology
What was the methodology we used to complete our nationwide rent price analysis?
- Geography: SFR markets in 646 U.S. cities across six regions.
- Property type: 3-BR SFRs with all bathroom counts.
- Analysis: Rent data was analyzed year-over-year for Q4 2022 and Q4 2023.
- Data: Includes data collected and updated between October 1st and December 31st for 2022 and 2023.
- Exclusions:
- Cities with fewer than 25 new or updated rentals within any quarter were excluded.
- Rentals below $500 (minimum price) or above $10,000 (maximum price) were excluded.
3: Nationwide Rent Price Analysis
Nationwide Rent Price Increases
The orange bar graph below shows the fifteen markets that had the largest rent increase in Q4 2023. Out of the 646 rental markets analyzed in this report, Birmingham, Michigan had the largest year-over-year rent increase of 39%, followed by Hamilton, Ohio (38%) and La Quinta, California (37%).

Nationwide Rent Price Decreases
Out of the 646 cities represented in this report, 14% of markets had rent decreases in Q4 2023. The blue bar graph below shows the fifteen markets that had the largest rent decreases. Brooklyn, New York had the largest year-over-year rent decrease of -29%, followed by Long Beach, New York (-16%) and Pompano Beach, FL (-14%).

4: Midwest Rent Price Analysis
Rent Price Changes in the Midwest
In the Midwest, Birmingham, Michigan had the largest year-over-year rent increase of 39%, while Springfield, Illinois had the largest decrease of -12%.
Rent Prices in Popular Midwest Markets
- Rent in Chicago, IL was $2,354 - up by 12% since this time last year
- Rent in Kansas City, MO was $1,565 - up by 3% since this time last year
- Rent in Minneapolis, MN was $2,274 - up by 10% since this time last year
| City/State | Q4 2022 Average Rent |
Q4 2023 Average Rent |
YoY % Change |
| Akron, OH | $1,176 | $1,213 | 3% |
| Anderson, IN | $1,118 | $1,150 | 3% |
| Ann Arbor, MI | $2,921 | $2,655 | -9% |
| Aurora, IL | $2,092 | $2,180 | 4% |
| Belleville, IL | $1,259 | $1,467 | 17% |
| Belton, MO | $1,658 | $1,685 | 2% |
| Birmingham, MI | $2,915 | $4,056 | 39% |
| Bloomington, IN | $1,943 | $2,166 | 11% |
| Canton, OH | $1,060 | $1,198 | 13% |
| Cedar Rapids, IA | $1,214 | $1,261 | 4% |
| Champaign, IL | $1,358 | $1,471 | 8% |
| Chicago, IL | $2,105 | $2,354 | 12% |
| Cincinnati, OH | $1,545 | $1,846 | 19% |
| Cleveland, OH | $1,411 | $1,526 | 8% |
| Columbia, MO | $1,529 | $1,716 | 12% |
| Columbus, OH | $1,549 | $1,757 | 13% |
| Davenport, IA | $1,340 | $1,362 | 2% |
| Dayton, OH | $1,235 | $1,375 | 11% |
| Des Moines, IA | $1,385 | $1,617 | 17% |
| Detroit, MI | $1,240 | $1,240 | 0% |
| Duluth, MN | $1,798 | $1,877 | 4% |
| Eastpointe, MI | $1,423 | $1,357 | -5% |
| Evansville, IN | $1,232 | $1,380 | 12% |
| Ferndale, MI | $1,845 | $1,998 | 8% |
| Fishers, IN | $1,750 | $2,006 | 15% |
| Flint, MI | $902 | $951 | 5% |
| Florissant, MO | $1,483 | $1,473 | -1% |
| Fort Wayne, IN | $1,291 | $1,463 | 13% |
| Franklin, IN | $1,518 | $1,615 | 6% |
| Garfield Heights, OH | $1,241 | $1,319 | 6% |
| Gary, IN | $1,236 | $1,324 | 7% |
| Grand Rapids, MI | $1,803 | $1,792 | -1% |
| Grandview, MO | $1,460 | $1,550 | 6% |
| Greenfield, IN | $1,553 | $1,628 | 5% |
| Greenwood, IN | $1,611 | $1,681 | 4% |
| Hamilton, OH | $1,287 | $1,774 | 38% |
| Hazelwood, MO | $1,409 | $1,548 | 10% |
| Hilliard, OH | $1,991 | $2,015 | 1% |
| Independence, MO | $1,407 | $1,453 | 3% |
| Indianapolis, IN | $1,488 | $1,630 | 10% |
| Inkster, MI | $1,322 | $1,226 | -7% |
| Iowa City, IA | $1,803 | $1,982 | 10% |
| Joliet, IL | $1,880 | $2,004 | 7% |
| Joplin, MO | $1,297 | $1,320 | 2% |
| Kalamazoo, MI | $1,624 | $1,736 | 7% |
| Kansas City, KS | $1,451 | $1,550 | 7% |
| Kansas City, MO | $1,513 | $1,565 | 3% |
| Lafayette, IN | $1,458 | $1,560 | 7% |
| Lansing, MI | $1,256 | $1,335 | 6% |
| Lee's Summit, MO | $1,770 | $1,935 | 9% |
| Lincoln, NE | $1,638 | $1,646 | 0% |
| Madison Heights, MI | $1,632 | $1,719 | 5% |
| Madison, WI | $2,239 | $2,514 | 12% |
| Maple Heights, OH | $1,206 | $1,321 | 10% |
| Middletown, OH | $1,346 | $1,545 | 15% |
| Milwaukee, WI | $1,433 | $1,606 | 12% |
| Minneapolis, MN | $2,062 | $2,274 | 10% |
| Muncie, IN | $1,134 | $1,137 | 0% |
| Naperville, IL | $2,728 | $2,959 | 8% |
| Noblesville, IN | $1,684 | $2,041 | 21% |
| O'Fallon, MO | $1,768 | $1,977 | 12% |
| Olathe, KS | $1,846 | $2,108 | 14% |
| Omaha, NE | $1,709 | $1,861 | 9% |
| Overland Park, KS | $1,979 | $2,219 | 12% |
| Peoria, IL | $1,179 | $1,177 | 0% |
| Prairie Village, KS | $2,092 | $2,220 | 6% |
| Raytown, MO | $1,369 | $1,482 | 8% |
| Reynoldsburg, OH | $1,784 | $1,837 | 3% |
| Rochester, MN | $1,629 | $2,005 | 23% |
| Rockford, IL | $1,277 | $1,528 | 20% |
| Royal Oak, MI | $2,081 | $2,321 | 12% |
| Saginaw, MI | $871 | $1,022 | 17% |
| Saint Paul, MN | $1,900 | $2,118 | 11% |
| Sioux Falls, SD | $1,608 | $1,821 | 13% |
| South Bend, IN | $1,354 | $1,582 | 17% |
| Springfield, IL | $1,381 | $1,218 | -12% |
| Springfield, MO | $1,355 | $1,397 | 3% |
| St. Louis, MO | $1,527 | $1,556 | 2% |
| Sterling Heights, MI | $2,086 | $2,067 | -1% |
| Toledo, OH | $1,115 | $1,192 | 7% |
| Topeka, KS | $1,129 | $1,300 | 15% |
| Warren, MI | $1,533 | $1,519 | -1% |
| Waterloo, IA | $1,056 | $1,108 | 5% |
| Westland, MI | $1,567 | $1,704 | 9% |
| Wichita, KS | $1,161 | $1,368 | 18% |
5: Northeast Rent Price Analysis
Rent Price Changes in the Northeast
In the Northeast, Jersey City, New Jersey had the largest year-over-year rent increase of 24%, while Brooklyn, New York had the largest decrease of -29%.
Rent Prices in Popular Northeast Markets
- Rent in Boston, MA was $3,717 - no significant change since this time last year
- Rent in Philadelphia, PA was $1,720 - down by -2% since this time last year
- Rent in Pittsburgh, PA was $1,802 - up by 9% since this time last year
| City/State | Q4 2022 Average Rent |
Q4 2023 Average Rent |
YoY % Change |
| Allentown, PA | $1,772 | $1,982 | 12% |
| Boston, MA | $3,704 | $3,717 | 0% |
| Brooklyn, NY | $3,630 | $2,575 | -29% |
| Buffalo, NY | $1,627 | $1,727 | 6% |
| Erie, PA | $1,167 | $1,416 | 21% |
| Harrisburg, PA | $1,472 | $1,613 | 10% |
| Jersey City, NJ | $2,581 | $3,200 | 24% |
| Lancaster, PA | $1,852 | $2,000 | 8% |
| Long Beach, NY | $4,021 | $3,397 | -16% |
| Newport, RI | $3,360 | $3,536 | 5% |
| Philadelphia, PA | $1,762 | $1,720 | -2% |
| Pittsburgh, PA | $1,652 | $1,802 | 9% |
| Queens, NY | $3,319 | $3,621 | 9% |
| Rochester, NY | $1,667 | $1,846 | 11% |
| Staten Island, NY | $2,832 | $3,150 | 11% |
| Syracuse, NY | $1,614 | $1,753 | 9% |
| The Bronx, NY | $3,089 | $3,031 | -2% |
| York, PA | $1,377 | $1,492 | 8% |
6: Pacific Rent Price Analysis
Rent Price Changes in the Pacific
In the Pacific, La Quinta, California had the largest year-over-year rent increase of 37%, while Yakima, Washington had the largest decrease of -9%.
Rent Prices in Popular Pacific Markets
- Rent in Los Angeles, CA was $5,056 - up by 4% since this time last year
- Rent in San Diego, CA was $4,489 - up by 3% since this time last year
- Rent in San Francisco, CA was $5,031 - down by -5% since this time last year
| City/State | Q4 2022 Average Rent |
Q4 2023 Average Rent |
YoY % Change |
| Anaheim, CA | $3,698 | $4,345 | 18% |
| Antioch, CA | $2,841 | $2,946 | 4% |
| Bakersfield, CA | $2,077 | $2,167 | 4% |
| Beaverton, OR | $2,491 | $2,616 | 5% |
| Bellevue, WA | $3,471 | $3,973 | 14% |
| Bellingham, WA | $2,547 | $2,804 | 10% |
| Bend, OR | $2,778 | $3,058 | 10% |
| Bothell, WA | $3,135 | $3,328 | 6% |
| Bremerton, WA | $2,370 | $2,445 | 3% |
| Burbank, CA | $4,732 | $5,079 | 7% |
| Carlsbad, CA | $5,114 | $5,551 | 9% |
| Chico, CA | $2,067 | $2,143 | 4% |
| Chula Vista, CA | $3,627 | $3,804 | 5% |
| Citrus Heights, CA | $2,485 | $2,538 | 2% |
| Clovis, CA | $2,311 | $2,341 | 1% |
| Concord, CA | $3,368 | $3,464 | 3% |
| Corona, CA | $3,031 | $3,076 | 1% |
| Costa Mesa, CA | $4,912 | $5,036 | 3% |
| Daly City, CA | $4,001 | $4,054 | 1% |
| Elk Grove, CA | $2,555 | $2,600 | 2% |
| Encinitas, CA | $5,477 | $6,376 | 16% |
| Escondido, CA | $3,584 | $3,820 | 7% |
| Eugene, OR | $2,272 | $2,292 | 1% |
| Everett, WA | $2,825 | $2,852 | 1% |
| Fairfield, CA | $2,744 | $2,888 | 5% |
| Folsom, CA | $2,769 | $2,964 | 7% |
| Fremont, CA | $3,639 | $3,819 | 5% |
| Fresno, CA | $2,188 | $2,263 | 3% |
| Glendale, CA | $5,166 | $5,374 | 4% |
| Hayward, CA | $3,403 | $3,504 | 3% |
| Hemet, CA | $2,380 | $2,502 | 5% |
| Hillsboro, OR | $2,525 | $2,533 | 0% |
| Huntington Beach, CA | $4,909 | $5,444 | 11% |
| Imperial Beach, CA | $3,672 | $4,408 | 20% |
| Indio, CA | $4,179 | $4,459 | 7% |
| Irvine, CA | $4,662 | $4,773 | 2% |
| Kennewick, WA | $1,992 | $2,271 | 14% |
| Kent, WA | $2,846 | $2,993 | 5% |
| Kirkland, WA | $3,345 | $3,612 | 8% |
| La Quinta, CA | $3,899 | $5,346 | 37% |
| Lacey, WA | $2,349 | $2,450 | 4% |
| Laguna Beach, CA | $7,585 | $7,667 | 1% |
| Lake Stevens, WA | $2,678 | $2,792 | 4% |
| Lancaster, CA | $2,600 | $2,808 | 8% |
| Livermore, CA | $3,431 | $3,633 | 6% |
| Long Beach, CA | $3,692 | $3,938 | 7% |
| Los Angeles, CA | $4,865 | $5,056 | 4% |
| Lynnwood, WA | $2,967 | $3,017 | 2% |
| Manhattan Beach, CA | $6,016 | $7,141 | 19% |
| Marysville, WA | $2,603 | $2,763 | 6% |
| Medford, OR | $2,192 | $2,234 | 2% |
| Menifee, CA | $2,701 | $3,133 | 16% |
| Merced, CA | $1,898 | $2,031 | 7% |
| Mission Viejo, CA | $4,109 | $4,674 | 14% |
| Modesto, CA | $2,208 | $2,331 | 6% |
| Moreno Valley, CA | $2,586 | $2,938 | 14% |
| Murrieta, CA | $2,840 | $2,957 | 4% |
| Napa, CA | $3,846 | $4,279 | 11% |
| Newport Beach, CA | $6,867 | $6,919 | 1% |
| Oak Harbor, WA | $2,280 | $2,387 | 5% |
| Oakland, CA | $4,075 | $3,956 | -3% |
| Oceanside, CA | $3,730 | $4,404 | 18% |
| Olympia, WA | $2,436 | $2,479 | 2% |
| Orange, CA | $3,771 | $4,259 | 13% |
| Oxnard, CA | $3,692 | $4,452 | 21% |
| Palmdale, CA | $2,600 | $2,793 | 7% |
| Pasadena, CA | $4,347 | $4,716 | 8% |
| Pasco, WA | $1,893 | $2,212 | 17% |
| Portland, OR | $2,704 | $2,835 | 5% |
| Puyallup, WA | $2,600 | $2,687 | 3% |
| Rancho Cucamonga, CA | $3,006 | $3,260 | 8% |
| Redding, CA | $1,929 | $2,130 | 10% |
| Redmond, OR | $2,343 | $2,501 | 7% |
| Redmond, WA | $3,382 | $3,547 | 5% |
| Redondo Beach, CA | $5,231 | $5,355 | 2% |
| Renton, WA | $2,804 | $3,159 | 13% |
| Richmond, CA | $3,395 | $3,302 | -3% |
| Ridgecrest, CA | $1,669 | $1,564 | -6% |
| Riverside, CA | $2,960 | $2,995 | 1% |
| Rocklin, CA | $2,681 | $2,780 | 4% |
| Roseville, CA | $2,620 | $2,762 | 5% |
| Sacramento, CA | $2,476 | $2,616 | 6% |
| Salem, OR | $2,247 | $2,270 | 1% |
| San Bernardino, CA | $2,574 | $2,648 | 3% |
| San Diego, CA | $4,343 | $4,489 | 3% |
| San Francisco, CA | $5,272 | $5,031 | -5% |
| San Jose, CA | $3,913 | $3,939 | 1% |
| San Mateo, CA | $5,310 | $5,400 | 2% |
| Santa Clara, CA | $4,124 | $4,380 | 6% |
| Santa Clarita, CA | $3,672 | $4,160 | 13% |
| Santa Maria, CA | $3,122 | $3,340 | 7% |
| Santa Rosa, CA | $3,296 | $3,536 | 7% |
| Seattle, WA | $3,544 | $3,589 | 1% |
| Simi Valley, CA | $3,621 | $3,782 | 4% |
| South Lake Tahoe, CA | $3,723 | $3,904 | 5% |
| Spokane, WA | $2,053 | $2,004 | -2% |
| Stockton, CA | $2,313 | $2,445 | 6% |
| Sunnyvale, CA | $4,387 | $4,606 | 5% |
| Tacoma, WA | $2,469 | $2,604 | 5% |
| Temecula, CA | $2,978 | $3,159 | 6% |
| Thousand Oaks, CA | $4,339 | $4,231 | -2% |
| Torrance, CA | $4,135 | $4,367 | 6% |
| Turlock, CA | $2,319 | $2,467 | 6% |
| Twentynine Palms, CA | $1,876 | $2,084 | 11% |
| Vacaville, CA | $2,974 | $2,901 | -2% |
| Vallejo, CA | $2,754 | $2,842 | 3% |
| Vancouver, WA | $2,359 | $2,483 | 5% |
| Victorville, CA | $2,244 | $2,312 | 3% |
| Visalia, CA | $2,102 | $2,105 | 0% |
| Walnut Creek, CA | $4,501 | $4,193 | -7% |
| Whittier, CA | $3,339 | $3,546 | 6% |
| Yakima, WA | $2,222 | $2,019 | -9% |
| Yuba City, CA | $2,236 | $2,162 | -3% |
7: Rocky Mountains Rent Price Analysis
Rent Price Changes in the Rocky Mountains
In the Rocky Mountains, Pueblo, Colorado had the largest year-over-year rent increase of 16%, while St. George, Utah had the largest decrease of -4%.
Rent Prices in Popular Rocky Mountains Markets
- Rent in Colorado Springs, CO was $2,185 - up by 2% since this time last year
- Rent in Denver, CO was $3,041 - up by 5% since this time last year
- Rent in Las Vegas, NV was $2,203 - up by 4% since this time last year
| City/State | Q4 2022 Average Rent |
Q4 2023 Average Rent |
YoY % Change |
| Arvada, CO | $2,850 | $2,817 | -1% |
| Aurora, CO | $2,529 | $2,703 | 7% |
| Billings, MT | $1,798 | $1,951 | 9% |
| Boise, ID | $2,204 | $2,295 | 4% |
| Boulder, CO | $3,671 | $3,924 | 7% |
| Brighton, CO | $2,538 | $2,750 | 8% |
| Broomfield, CO | $2,587 | $2,950 | 14% |
| Castle Rock, CO | $2,872 | $2,958 | 3% |
| Centennial, CO | $2,684 | $2,971 | 11% |
| Coeur d'Alene, ID | $2,270 | $2,322 | 2% |
| Colorado Springs, CO | $2,143 | $2,185 | 2% |
| Commerce City, CO | $2,531 | $2,855 | 13% |
| Denver, CO | $2,903 | $3,041 | 5% |
| Eagle Mountain, UT | $2,047 | $2,080 | 2% |
| Eagle, ID | $2,391 | $2,527 | 6% |
| Englewood, CO | $2,699 | $2,802 | 4% |
| Fernley, NV | $1,899 | $1,981 | 4% |
| Fort Collins, CO | $2,419 | $2,568 | 6% |
| Fountain, CO | $2,039 | $2,143 | 5% |
| Grand Junction, CO | $1,865 | $2,078 | 11% |
| Greeley, CO | $2,238 | $2,178 | -3% |
| Henderson, NV | $2,296 | $2,377 | 4% |
| Las Vegas, NV | $2,113 | $2,203 | 4% |
| Littleton, CO | $2,835 | $3,216 | 13% |
| Longmont, CO | $2,463 | $2,657 | 8% |
| Loveland, CO | $2,364 | $2,384 | 1% |
| Meridian, ID | $2,131 | $2,229 | 5% |
| Nampa, ID | $2,102 | $2,040 | -3% |
| North Las Vegas, NV | $1,991 | $1,963 | -1% |
| Parker, CO | $2,716 | $3,054 | 12% |
| Pueblo, CO | $1,445 | $1,678 | 16% |
| Reno, NV | $2,583 | $2,642 | 2% |
| Salt Lake City, UT | $2,464 | $2,439 | -1% |
| Sparks, NV | $2,293 | $2,408 | 5% |
| St. George, UT | $2,234 | $2,150 | -4% |
| Thornton, CO | $2,635 | $2,698 | 2% |
| Washington, UT | $2,082 | $2,207 | 6% |
| Westminster, CO | $2,641 | $2,698 | 2% |
8: Southeast Rent Price Analysis
Rent Price Changes in the Southeast
In the Southeast, Vero Beach, Florida had the largest year-over-year rent increase of 30%, while Pompano Beach, Florida had the largest decrease of -14%.
Rent Prices in Popular Southeast Markets
- Rent in Atlanta, GA was $2,490 - up by 8% since this time last year
- Rent in Miami, FL was $3,759 - down by -6% since this time last year
- Rent in Orlando, FL was $2,369 - up by 4% since this time last year
| City/State | Q4 2022 Average Rent |
Q4 2023 Average Rent |
YoY % Change |
| Acworth, GA | $2,045 | $2,197 | 7% |
| Aiken, SC | $1,551 | $1,842 | 19% |
| Albany, GA | $1,159 | $1,137 | -2% |
| Alexandria, VA | $3,156 | $2,840 | -10% |
| Alpharetta, GA | $2,487 | $2,764 | 11% |
| Anderson, SC | $1,382 | $1,714 | 24% |
| Apex, NC | $2,110 | $2,097 | -1% |
| Arlington, VA | $3,696 | $3,507 | -5% |
| Asheville, NC | $2,379 | $2,723 | 14% |
| Athens, AL | $1,548 | $1,672 | 8% |
| Athens, GA | $1,894 | $2,039 | 8% |
| Atlanta, GA | $2,297 | $2,490 | 8% |
| Augusta, GA | $1,342 | $1,449 | 8% |
| Baltimore, MD | $1,943 | $1,753 | -10% |
| Baton Rouge, LA | $1,619 | $1,737 | 7% |
| Bella Vista, AR | $1,919 | $1,940 | 1% |
| Bentonville, AR | $1,724 | $1,873 | 9% |
| Bessemer, AL | $1,398 | $1,358 | -3% |
| Birmingham, AL | $1,403 | $1,427 | 2% |
| Boca Raton, FL | $4,448 | $4,840 | 9% |
| Bonita Springs, FL | $5,485 | $6,213 | 13% |
| Bossier City, LA | $1,398 | $1,410 | 1% |
| Bowling Green, KY | $1,563 | $1,694 | 8% |
| Boynton Beach, FL | $3,767 | $4,159 | 10% |
| Bradenton, FL | $2,812 | $3,592 | 28% |
| Brandon, FL | $2,178 | $2,248 | 3% |
| Buford, GA | $2,203 | $2,205 | 0% |
| Burlington, NC | $1,545 | $1,759 | 14% |
| Cabot, AR | $1,343 | $1,412 | 5% |
| Canton, GA | $2,047 | $2,122 | 4% |
| Cape Coral, FL | $3,093 | $2,738 | -11% |
| Cary, NC | $2,179 | $2,272 | 4% |
| Casselberry, FL | $2,069 | $2,207 | 7% |
| Center Point, AL | $1,128 | $1,202 | 7% |
| Centerton, AR | $1,723 | $1,694 | -2% |
| Charleston, SC | $2,780 | $3,542 | 27% |
| Charlotte, NC | $1,928 | $2,085 | 8% |
| Charlottesville, VA | $2,185 | $2,619 | 20% |
| Chattanooga, TN | $1,877 | $1,953 | 4% |
| Chesapeake, VA | $1,909 | $2,108 | 10% |
| Clarksville, TN | $1,635 | $1,699 | 4% |
| Clayton, NC | $1,839 | $1,884 | 2% |
| Clearwater, FL | $2,600 | $2,957 | 14% |
| Clermont, FL | $2,257 | $2,300 | 2% |
| Cocoa, FL | $2,078 | $2,017 | -3% |
| College Park, GA | $1,795 | $1,876 | 5% |
| Columbia, SC | $1,550 | $1,677 | 8% |
| Columbia, TN | $2,030 | $1,900 | -6% |
| Columbus, GA | $1,247 | $1,256 | 1% |
| Concord, NC | $1,835 | $1,873 | 2% |
| Conway, AR | $1,384 | $1,426 | 3% |
| Conway, SC | $1,997 | $1,972 | -1% |
| Conyers, GA | $1,755 | $1,753 | 0% |
| Coral Springs, FL | $3,272 | $3,407 | 4% |
| Covington, GA | $1,755 | $1,761 | 0% |
| Crestview, FL | $1,809 | $1,838 | 2% |
| Dallas, GA | $1,827 | $1,844 | 1% |
| Davie, FL | $3,777 | $3,669 | -3% |
| Daytona Beach, FL | $2,226 | $2,144 | -4% |
| Decatur, GA | $1,864 | $1,931 | 4% |
| DeLand, FL | $2,012 | $2,095 | 4% |
| Delray Beach, FL | $4,732 | $4,619 | -2% |
| Deltona, FL | $1,801 | $1,957 | 9% |
| Douglasville, GA | $1,795 | $1,809 | 1% |
| Duluth, GA | $2,162 | $2,331 | 8% |
| Durham, NC | $1,944 | $2,168 | 12% |
| East Point, GA | $1,930 | $1,875 | -3% |
| Enterprise, AL | $1,439 | $1,571 | 9% |
| Eustis, FL | $2,007 | $2,009 | 0% |
| Fairburn, GA | $2,004 | $2,005 | 0% |
| Fairhope, AL | $1,996 | $2,298 | 15% |
| Fayetteville, AR | $1,787 | $1,965 | 10% |
| Fayetteville, GA | $2,320 | $2,515 | 8% |
| Fayetteville, NC | $1,383 | $1,471 | 6% |
| Fernandina Beach, FL | $2,565 | $3,076 | 20% |
| Fort Lauderdale, FL | $4,120 | $4,358 | 6% |
| Fort Myers, FL | $3,499 | $3,285 | -6% |
| Fort Pierce, FL | $2,646 | $2,720 | 3% |
| Fort Smith, AR | $1,342 | $1,281 | -5% |
| Fort Walton Beach, FL | $2,241 | $2,228 | -1% |
| Franklin, TN | $2,982 | $3,245 | 9% |
| Fredericksburg, VA | $2,052 | $2,264 | 10% |
| Fuquay-Varina, NC | $1,913 | $2,082 | 9% |
| Gainesville, FL | $2,047 | $2,175 | 6% |
| Gainesville, GA | $2,337 | $2,036 | -13% |
| Garner, NC | $2,037 | $1,993 | -2% |
| Gastonia, NC | $1,610 | $1,706 | 6% |
| Greensboro, NC | $1,604 | $1,688 | 5% |
| Greenville, NC | $1,697 | $1,768 | 4% |
| Greenville, SC | $1,762 | $1,891 | 7% |
| Greer, SC | $1,735 | $1,831 | 6% |
| Griffin, GA | $1,595 | $1,485 | -7% |
| Grovetown, GA | $1,651 | $1,679 | 2% |
| Gulfport, MS | $1,326 | $1,591 | 20% |
| Haines City, FL | $2,090 | $2,054 | -2% |
| Hampton, VA | $1,692 | $1,825 | 8% |
| Hattiesburg, MS | $1,394 | $1,462 | 5% |
| Helena, AL | $1,744 | $1,800 | 3% |
| Hendersonville, TN | $2,109 | $2,351 | 11% |
| Hialeah, FL | $3,384 | $3,476 | 3% |
| High Point, NC | $1,512 | $1,560 | 3% |
| Hinesville, GA | $1,501 | $1,589 | 6% |
| Holly Springs, NC | $1,846 | $2,055 | 11% |
| Hollywood, FL | $4,167 | $3,974 | -5% |
| Homestead, FL | $2,831 | $2,964 | 5% |
| Horn Lake, MS | $1,413 | $1,491 | 6% |
| Hudson, FL | $2,027 | $2,209 | 9% |
| Huntersville, NC | $2,025 | $2,105 | 4% |
| Huntsville, AL | $1,542 | $1,645 | 7% |
| Indian Trail, NC | $1,932 | $1,991 | 3% |
| Jackson, MS | $1,173 | $1,231 | 5% |
| Jackson, TN | $1,655 | $1,755 | 6% |
| Jacksonville Beach, FL | $3,124 | $3,395 | 9% |
| Jacksonville, AR | $1,104 | $1,184 | 7% |
| Jacksonville, FL | $1,753 | $1,740 | -1% |
| Jacksonville, NC | $1,493 | $1,575 | 5% |
| Jonesboro, AR | $1,365 | $1,494 | 9% |
| Jupiter, FL | $5,045 | $5,430 | 8% |
| Kannapolis, NC | $1,580 | $1,744 | 10% |
| Kennesaw, GA | $2,031 | $2,215 | 9% |
| Kissimmee, FL | $2,026 | $2,207 | 9% |
| Knoxville, TN | $2,057 | $2,200 | 7% |
| La Vergne, TN | $1,824 | $1,937 | 6% |
| Lafayette, LA | $1,512 | $1,648 | 9% |
| Lake Charles, LA | $1,279 | $1,351 | 6% |
| Lakeland, FL | $1,958 | $1,972 | 1% |
| Largo, FL | $2,509 | $2,819 | 12% |
| Lawrenceville, GA | $2,015 | $2,134 | 6% |
| Lebanon, TN | $1,994 | $2,331 | 17% |
| Leesburg, FL | $1,821 | $2,051 | 13% |
| Lehigh Acres, FL | $2,206 | $2,181 | -1% |
| Lexington, KY | $1,605 | $1,724 | 7% |
| Lexington, SC | $1,776 | $1,886 | 6% |
| Little Rock, AR | $1,263 | $1,492 | 18% |
| Loganville, GA | $2,037 | $1,987 | -2% |
| Louisville, KY | $1,470 | $1,572 | 7% |
| Lynchburg, VA | $1,544 | $1,780 | 15% |
| Macon, GA | $1,212 | $1,412 | 17% |
| Madison, AL | $1,731 | $1,820 | 5% |
| Marietta, GA | $2,111 | $2,343 | 11% |
| Maryville, TN | $2,204 | $2,189 | -1% |
| Matthews, NC | $2,002 | $2,152 | 7% |
| McDonough, GA | $1,888 | $1,906 | 1% |
| Melbourne, FL | $2,236 | $2,326 | 4% |
| Memphis, TN | $1,370 | $1,441 | 5% |
| Metairie, LA | $2,137 | $2,322 | 9% |
| Miami, FL | $4,006 | $3,759 | -6% |
| Milton, FL | $1,644 | $1,731 | 5% |
| Miramar, FL | $3,425 | $3,315 | -3% |
| Mobile, AL | $1,315 | $1,520 | 16% |
| Moncks Corner, SC | $1,835 | $1,996 | 9% |
| Monroe, NC | $1,848 | $1,815 | -2% |
| Montgomery, AL | $1,154 | $1,256 | 9% |
| Mooresville, NC | $1,917 | $2,122 | 11% |
| Morgantown, WV | $1,457 | $1,621 | 11% |
| Mt. Juliet, TN | $2,266 | $2,377 | 5% |
| Murfreesboro, TN | $1,993 | $2,082 | 4% |
| Myrtle Beach, SC | $2,020 | $2,185 | 8% |
| Naples, FL | $5,115 | $5,787 | 13% |
| Nashville, TN | $2,520 | $2,616 | 4% |
| New Orleans, LA | $2,161 | $2,336 | 8% |
| New Port Richey, FL | $2,051 | $2,025 | -1% |
| New Smyrna Beach, FL | $2,873 | $3,140 | 9% |
| Newnan, GA | $1,928 | $1,998 | 4% |
| Newport News, VA | $1,534 | $1,835 | 20% |
| Norcross, GA | $2,171 | $2,406 | 11% |
| Norfolk, VA | $1,873 | $1,995 | 7% |
| North Charleston, SC | $2,002 | $2,256 | 13% |
| North Little Rock, AR | $1,130 | $1,269 | 12% |
| North Port, FL | $2,411 | $2,344 | -3% |
| Ocala, FL | $1,942 | $2,040 | 5% |
| Olive Branch, MS | $1,706 | $1,771 | 4% |
| Orlando, FL | $2,268 | $2,369 | 4% |
| Ormond Beach, FL | $2,549 | $2,719 | 7% |
| Oviedo, FL | $2,226 | $2,364 | 6% |
| Oxford, MS | $1,791 | $2,223 | 24% |
| Palm Bay, FL | $1,977 | $1,979 | 0% |
| Palm Beach Gardens, FL | $5,871 | $5,796 | -1% |
| Palm Coast, FL | $2,284 | $2,274 | 0% |
| Panama City, FL | $1,874 | $2,077 | 11% |
| Peachtree City, GA | $2,223 | $2,309 | 4% |
| Pembroke Pines, FL | $3,476 | $3,625 | 4% |
| Pensacola, FL | $1,812 | $1,929 | 6% |
| Petersburg, VA | $1,383 | $1,554 | 12% |
| Phenix City, AL | $1,296 | $1,379 | 6% |
| Plant City, FL | $2,070 | $2,252 | 9% |
| Pompano Beach, FL | $5,216 | $4,471 | -14% |
| Pooler, GA | $2,042 | $2,157 | 6% |
| Port Charlotte, FL | $2,580 | $2,574 | 0% |
| Port St. Lucie, FL | $2,664 | $2,772 | 4% |
| Portsmouth, VA | $1,720 | $1,889 | 10% |
| Powder Springs, GA | $1,855 | $1,929 | 4% |
| Punta Gorda, FL | $3,241 | $3,593 | 11% |
| Raleigh, NC | $1,929 | $2,096 | 9% |
| Richmond, VA | $1,867 | $2,034 | 9% |
| Riverdale, GA | $1,723 | $1,752 | 2% |
| Riverview, FL | $1,838 | $2,243 | 22% |
| Roanoke, VA | $1,459 | $1,675 | 15% |
| Rock Hill, SC | $1,834 | $1,857 | 1% |
| Rockledge, FL | $2,079 | $2,344 | 13% |
| Rogers, AR | $1,781 | $1,961 | 10% |
| Royal Palm Beach, FL | $3,531 | $3,718 | 5% |
| Ruston, LA | $1,155 | $1,358 | 18% |
| Salisbury, NC | $1,460 | $1,682 | 15% |
| Sanford, FL | $2,002 | $2,133 | 7% |
| Sarasota, FL | $3,239 | $3,725 | 15% |
| Savannah, GA | $2,170 | $2,311 | 7% |
| Seminole, FL | $2,978 | $2,770 | -7% |
| Shelby County, TN | $1,710 | $1,785 | 4% |
| Sherwood, AR | $1,400 | $1,567 | 12% |
| Shreveport, LA | $1,184 | $1,198 | 1% |
| Simpsonville, SC | $1,873 | $1,838 | -2% |
| Smyrna, TN | $1,965 | $2,068 | 5% |
| Snellville, GA | $1,870 | $1,983 | 6% |
| Spartanburg, SC | $1,369 | $1,544 | 13% |
| Spring Hill, FL | $1,932 | $2,039 | 6% |
| Spring Hill, TN | $2,145 | $2,179 | 2% |
| Springdale, AR | $1,688 | $1,652 | -2% |
| St. Augustine, FL | $2,469 | $2,492 | 1% |
| St. Cloud, FL | $2,174 | $2,308 | 6% |
| St. Petersburg, FL | $2,783 | $3,006 | 8% |
| Statesville, NC | $1,700 | $1,739 | 2% |
| Stockbridge, GA | $1,819 | $1,830 | 1% |
| Sulphur, LA | $1,220 | $1,507 | 24% |
| Summerville, SC | $1,896 | $2,173 | 15% |
| Sumter, SC | $1,319 | $1,513 | 15% |
| Sunrise, FL | $3,054 | $3,333 | 9% |
| Tallahassee, FL | $1,808 | $2,028 | 12% |
| Tampa, FL | $2,485 | $2,617 | 5% |
| Tuscaloosa, AL | $1,488 | $1,691 | 14% |
| Union City, GA | $1,976 | $1,936 | -2% |
| Valdosta, GA | $1,237 | $1,296 | 5% |
| Valrico, FL | $1,965 | $2,198 | 12% |
| Venice, FL | $3,505 | $3,801 | 8% |
| Vero Beach, FL | $2,814 | $3,672 | 30% |
| Villa Rica, GA | $1,789 | $1,811 | 1% |
| Virginia Beach, VA | $2,117 | $2,127 | 0% |
| Warner Robins, GA | $1,342 | $1,564 | 17% |
| Washington, DC | $3,825 | $3,521 | -8% |
| Wellington, FL | $5,189 | $5,517 | 6% |
| West Palm Beach, FL | $3,836 | $4,095 | 7% |
| Weston, FL | $3,635 | $3,951 | 9% |
| Wilmington, NC | $2,198 | $2,249 | 2% |
| Winston-Salem, NC | $1,591 | $1,661 | 4% |
| Winter Haven, FL | $1,790 | $1,934 | 8% |
| Winter Park, FL | $2,571 | $2,599 | 1% |
| Winter Springs, FL | $2,238 | $2,238 | 0% |
| Woodstock, GA | $2,120 | $2,338 | 10% |
| Yulee, FL | $2,076 | $2,043 | -2% |
| Zephyrhills, FL | $2,143 | $2,175 | 1% |
9: Southwest Rent Price Analysis
Rent Price Changes in the Southwest
In the Southwest, Midlothian, Texas had the largest year-over-year rent increase of 21%, while Flagstaff, Arizona had the largest decrease of -7%.
Rent Prices in Popular Southwest Markets
- Rent in Austin, TX was $2,771 - down by -4% since this time last year
- Rent in Dallas, TX was $2,731 - up by 4% since this time last year
- Rent in Houston, TX was $2,305 - up by 8% since this time last year
| City/State | Q4 2022 Average Rent |
Q4 2023 Average Rent |
YoY % Change |
| Abilene, TX | $1,404 | $1,554 | 11% |
| Albuquerque, NM | $2,004 | $2,167 | 8% |
| Allen, TX | $2,317 | $2,513 | 8% |
| Alvin, TX | $1,928 | $1,977 | 3% |
| Amarillo, TX | $1,552 | $1,592 | 3% |
| Anna, TX | $2,023 | $2,085 | 3% |
| Apache Junction, AZ | $1,859 | $2,033 | 9% |
| Arlington, TX | $2,086 | $2,164 | 4% |
| Austin, TX | $2,890 | $2,771 | -4% |
| Avondale, AZ | $2,013 | $2,100 | 4% |
| Baytown, TX | $1,709 | $1,855 | 9% |
| Beaumont, TX | $1,539 | $1,515 | -2% |
| Belton, TX | $1,790 | $1,883 | 5% |
| Bixby, OK | $1,765 | $1,857 | 5% |
| Broken Arrow, OK | $1,561 | $1,715 | 10% |
| Brownsville, TX | $1,695 | $1,911 | 13% |
| Bryan, TX | $1,778 | $1,795 | 1% |
| Buckeye, AZ | $1,914 | $2,041 | 7% |
| Buda, TX | $2,184 | $2,247 | 3% |
| Burleson, TX | $1,958 | $2,033 | 4% |
| Canyon Lake, TX | $1,966 | $2,069 | 5% |
| Carrollton, TX | $2,657 | $2,682 | 1% |
| Casa Grande, AZ | $1,851 | $1,952 | 5% |
| Cedar Hill, TX | $2,065 | $2,129 | 3% |
| Cedar Park, TX | $2,280 | $2,255 | -1% |
| Chandler, AZ | $2,349 | $2,488 | 6% |
| Cibolo, TX | $1,823 | $1,945 | 7% |
| Cleveland, TX | $1,656 | $1,619 | -2% |
| College Station, TX | $1,863 | $1,907 | 2% |
| Conroe, TX | $1,878 | $1,933 | 3% |
| Converse, TX | $1,718 | $1,711 | 0% |
| Coppell, TX | $2,748 | $2,667 | -3% |
| Copperas Cove, TX | $1,382 | $1,350 | -2% |
| Corpus Christi, TX | $1,860 | $1,904 | 2% |
| Crowley, TX | $1,984 | $2,090 | 5% |
| Cypress, TX | $2,084 | $2,132 | 2% |
| Dallas, TX | $2,637 | $2,731 | 4% |
| Del City, OK | $1,125 | $1,172 | 4% |
| Denison, TX | $1,568 | $1,588 | 1% |
| Denton, TX | $1,996 | $2,113 | 6% |
| Duncanville, TX | $1,951 | $1,953 | 0% |
| Edmond, OK | $1,751 | $1,769 | 1% |
| El Mirage, AZ | $1,816 | $1,865 | 3% |
| El Paso, TX | $1,593 | $1,670 | 5% |
| Ennis, TX | $1,808 | $1,766 | -2% |
| Euless, TX | $2,640 | $2,487 | -6% |
| Flagstaff, AZ | $2,983 | $2,788 | -7% |
| Fort Worth, TX | $2,030 | $2,123 | 5% |
| Friendswood, TX | $1,869 | $2,071 | 11% |
| Frisco, TX | $2,655 | $2,875 | 8% |
| Garland, TX | $2,022 | $2,156 | 7% |
| Georgetown, TX | $2,186 | $2,292 | 5% |
| Gilbert, AZ | $2,263 | $2,329 | 3% |
| Glendale, AZ | $2,018 | $2,393 | 19% |
| Goodyear, AZ | $2,063 | $2,294 | 11% |
| Granbury, TX | $1,993 | $2,197 | 10% |
| Grand Prairie, TX | $2,197 | $2,348 | 7% |
| Grapevine, TX | $2,770 | $2,785 | 1% |
| Greenville, TX | $1,634 | $1,662 | 2% |
| Houston, TX | $2,131 | $2,305 | 8% |
| Humble, TX | $1,813 | $1,948 | 7% |
| Hutto, TX | $2,122 | $2,128 | 0% |
| Irving, TX | $2,492 | $2,735 | 10% |
| Katy, TX | $1,994 | $2,123 | 6% |
| Killeen, TX | $1,467 | $1,503 | 2% |
| Kyle, TX | $1,944 | $2,038 | 5% |
| La Marque, TX | $1,506 | $1,777 | 18% |
| La Porte, TX | $1,936 | $2,012 | 4% |
| Lancaster, TX | $1,928 | $1,940 | 1% |
| Laredo, TX | $1,852 | $1,929 | 4% |
| Las Cruces, NM | $1,650 | $1,750 | 6% |
| Lawton, OK | $1,040 | $1,163 | 12% |
| League City, TX | $2,074 | $2,260 | 9% |
| Leander, TX | $2,200 | $2,145 | -3% |
| Lewisville, TX | $2,419 | $2,531 | 5% |
| Little Elm, TX | $2,312 | $2,286 | -1% |
| Lubbock, TX | $1,478 | $1,474 | 0% |
| Manor, TX | $2,157 | $2,092 | -3% |
| Mansfield, TX | $2,153 | $2,368 | 10% |
| Maricopa, AZ | $1,867 | $1,907 | 2% |
| McAllen, TX | $1,857 | $1,815 | -2% |
| McKinney, TX | $2,442 | $2,456 | 1% |
| Mesa, AZ | $2,170 | $2,433 | 12% |
| Mesquite, TX | $2,001 | $2,046 | 2% |
| Midland, TX | $2,300 | $2,580 | 12% |
| Midlothian, TX | $2,028 | $2,451 | 21% |
| Midwest City, OK | $1,300 | $1,239 | -5% |
| Missouri City, TX | $1,914 | $2,072 | 8% |
| Montgomery, TX | $2,236 | $2,286 | 2% |
| Moore, OK | $1,435 | $1,466 | 2% |
| Mustang, OK | $1,549 | $1,584 | 2% |
| New Braunfels, TX | $2,010 | $1,992 | -1% |
| Norman, OK | $1,544 | $1,602 | 4% |
| North Richland Hills, TX | $2,145 | $2,260 | 5% |
| Odessa, TX | $2,114 | $2,184 | 3% |
| Oklahoma City, OK | $1,465 | $1,592 | 9% |
| Pasadena, TX | $1,720 | $1,663 | -3% |
| Pearland, TX | $2,116 | $2,257 | 7% |
| Peoria, AZ | $2,040 | $2,308 | 13% |
| Pflugerville, TX | $2,179 | $2,138 | -2% |
| Phoenix, AZ | $2,168 | $2,331 | 8% |
| Plano, TX | $2,558 | $2,826 | 10% |
| Porter, TX | $1,855 | $1,845 | -1% |
| Prescott Valley, AZ | $2,295 | $2,264 | -1% |
| Princeton, TX | $1,990 | $2,002 | 1% |
| Prosper, TX | $3,029 | $2,842 | -6% |
| Queen Creek, AZ | $1,965 | $2,297 | 17% |
| Richardson, TX | $2,399 | $2,795 | 17% |
| Richmond, TX | $2,054 | $2,187 | 6% |
| Rio Rancho, NM | $1,945 | $2,168 | 11% |
| Rosenberg, TX | $1,862 | $2,057 | 10% |
| Round Rock, TX | $2,136 | $2,133 | 0% |
| Rowlett, TX | $2,227 | $2,526 | 13% |
| Royse City, TX | $2,089 | $2,166 | 4% |
| San Angelo, TX | $1,547 | $1,542 | 0% |
| San Antonio, TX | $1,839 | $1,844 | 0% |
| San Marcos, TX | $1,923 | $1,990 | 3% |
| Santa Fe, NM | $3,411 | $3,429 | 1% |
| Schertz, TX | $1,899 | $1,843 | -3% |
| Scottsdale, AZ | $3,885 | $4,251 | 9% |
| Seguin, TX | $1,789 | $1,964 | 10% |
| Sherman, TX | $1,717 | $1,918 | 12% |
| Spring, TX | $2,015 | $2,203 | 9% |
| Sugar Land, TX | $1,999 | $2,169 | 9% |
| Surprise, AZ | $2,060 | $2,135 | 4% |
| Tempe, AZ | $2,417 | $2,469 | 2% |
| Temple, TX | $1,696 | $1,730 | 2% |
| Texas City, TX | $1,517 | $1,641 | 8% |
| The Colony, TX | $2,252 | $2,324 | 3% |
| The Village, OK | $1,476 | $1,439 | -3% |
| The Woodlands, TX | $2,485 | $2,759 | 11% |
| Tomball, TX | $2,152 | $2,077 | -3% |
| Tucson, AZ | $1,855 | $2,061 | 11% |
| Tulsa, OK | $1,439 | $1,583 | 10% |
| Tyler, TX | $1,824 | $1,863 | 2% |
| Waco, TX | $1,694 | $1,646 | -3% |
| Watauga, TX | $1,920 | $1,963 | 2% |
| Waxahachie, TX | $2,091 | $2,293 | 10% |
| Wichita Falls, TX | $1,485 | $1,399 | -6% |
| Willis, TX | $1,659 | $1,962 | 18% |
| Yukon, OK | $1,581 | $1,588 | 0% |
| Yuma, AZ | $1,685 | $1,721 | 2% |
10: Conclusion
Rentometer will continue to monitor rent prices in the upcoming year to see how they are impacted as the housing market continues to evolve in 2024. It is important now more than ever to know the market rent in your area to remain competitive and make informed real estate decisions. To access rent data in your area, click here.
Access Rent Data 24/7
Make data-driven real estate decisions with Rentometer - the fastest way to check residential rent prices in the U.S. Start a free trial today!
About Rentometer
Rentometer collects, analyzes, and distributes multifamily and SFR rent price data throughout the U.S. Our rental data is proven to be valuable for our diverse customer base including real estate investors, property managers, agents, other real estate professionals, and renters as we deliver more than 20,000 reports on a daily basis. For more information, please contact us at info@rentometer.com or visit us at www.rentometer.com.